Figure 3:
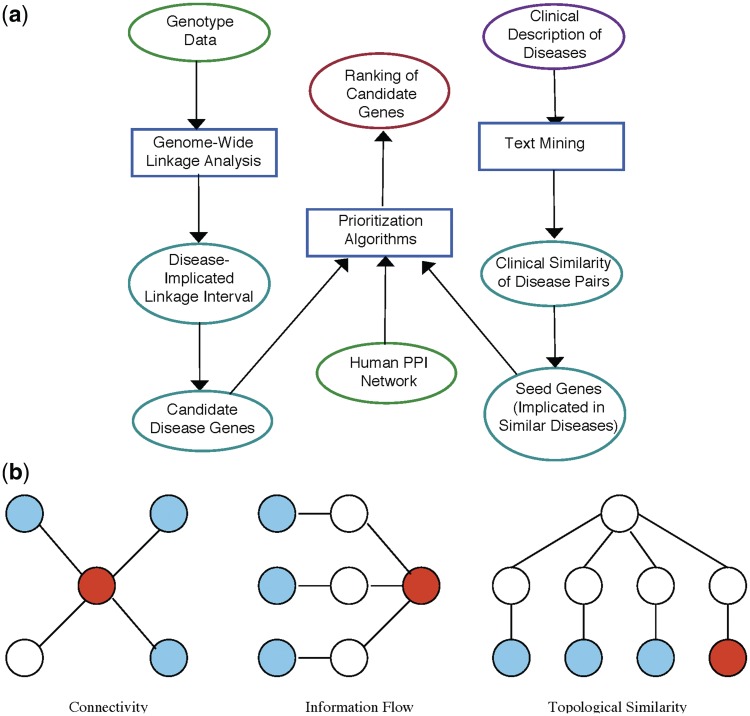
Network-based prioritization of candidate disease genes. (A) Flow chart for network-based prioritization algorithms: -omic data are shown by green ellipses (top left), clinical data are shown by purple ellipses (top right), intermediary data are shown by cyan ellipses (left and right bottom two ellipses), computational algorithms and statistical analyses are shown by boxes, overall outcome of the framework is shown by a red ellipse (top middle). (B) Key principles employed by prioritization algorithms: Each panel shows part of a hypothetical PPI network, blue nodes (light grey) represent products of seed genes, red nodes (dark grey) represent products of candidate genes. Connectivity-based algorithms rank candidate genes based on their products direct interactions with product's of seed genes; information-flow based algorithms rank candidate genes based on themultiplicity of network paths between their products and products of seed genes; topological similarity based algorithms rank candidate genes based on the similarity of their products' location in the PPI network to that of the products of candidate genes.

