
Figure 5. Flow cytometric analysis of leukocyte subsets.
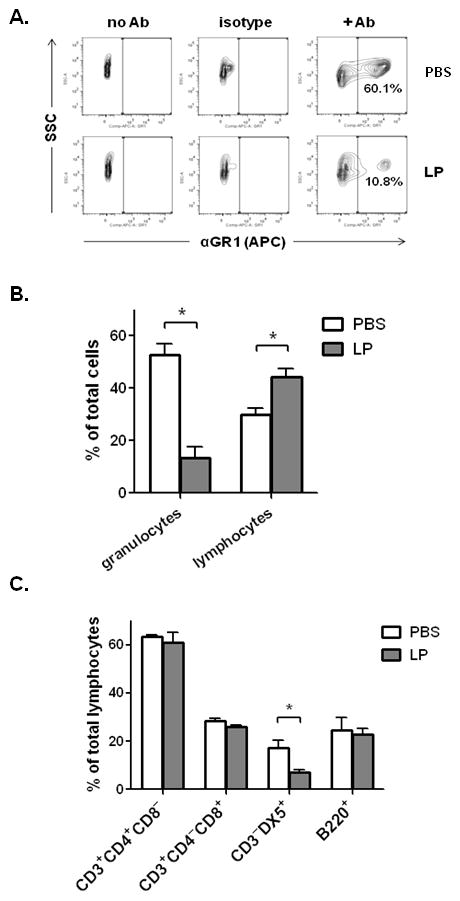
A. Flow cytometric analysis of whole-lung single-cell suspensions generated from control-(PBS + BSA) or L. plantarum (LP)-primed, PVM-infected mice (day 7, n = 5 – 6 mice per condition). Total lung cells were gated for side-scatter (SSC) and expression of the cell surface granulocyte marker GR1, shown with no-antibody and isotype-matched antibody controls. Data shown are representative of four independent experiments. B. Percentage of total viable lung cells identified as granulocytes (GR1+) or lymphocytes (identified by characteristic forward/side scatter) from PBS + BSA-primed, PVM-infected or L. plantarum-primed, PVM-infected mice. C. Percentage of total viable lymphocytes (in B.), with CD4+ T cell (CD3+CD4+CD8−), CD8+ T cell (CD3+CD4−CD8+) NK cell (CD3−DX5+) or B lymphocyte (B220+) immunophenotype; * = p < 0.05; ** = p < 0.01. Data shown are compiled from four independent experiments.