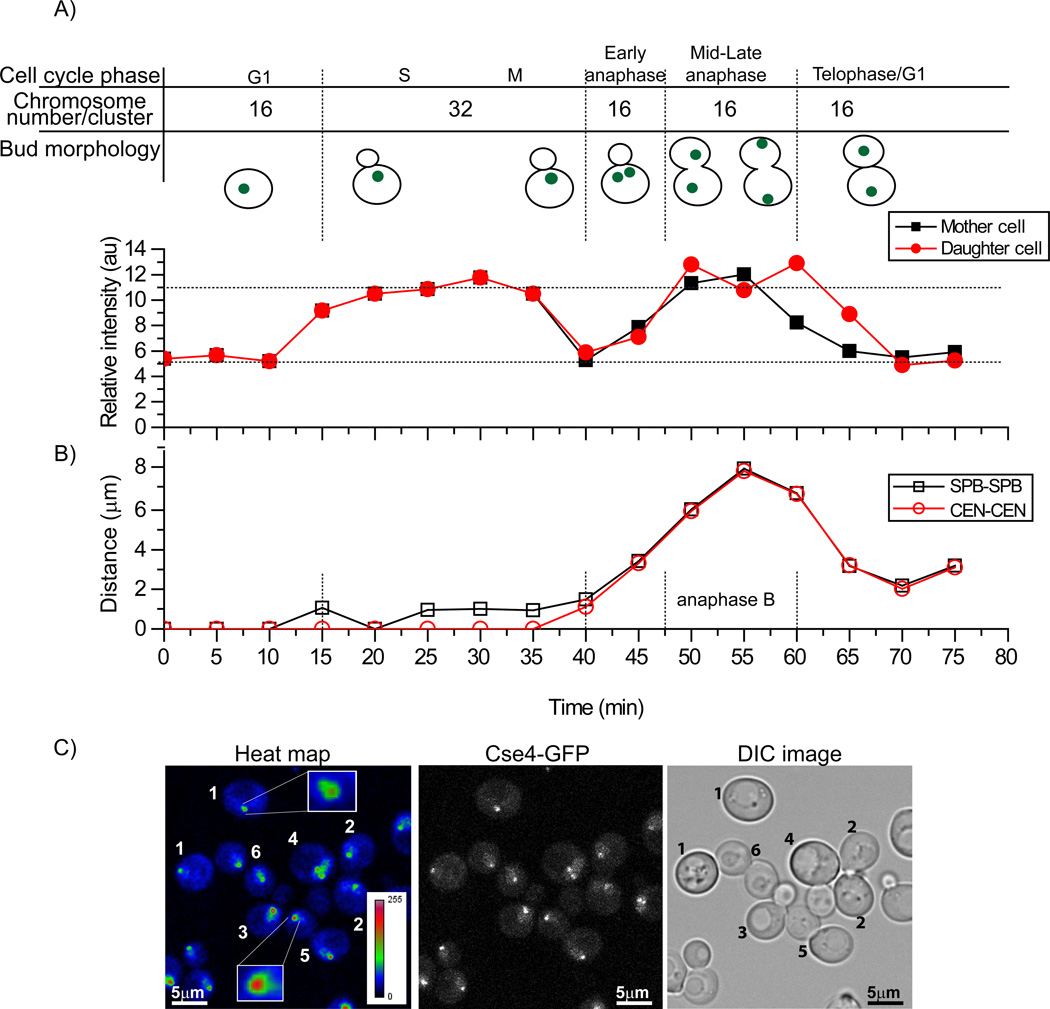
Figure 1. Cse4-EGFP intensity doubles at anaphase B.
A) Time-lapse series of a centromere cluster followed from G1 to telophase indicates that Cse4 intensity doubles in anaphase. Quantification of centromere localized Cse4-EGFP-fluorescence shows that at anaphase the intensity doubled compared to G1 and telophase (n=14). B) The spindle pole body (SPB) was used as a cell cycle stage marker and the distances were measured between SPBs and centromere clusters in 3D using Image J. C) Anaphase centromeric clusters are brighter than clusters in G1/telophase cells. The left panel shows a heat map for centromeric Cse4-EGFP brightness in different stages of cells. The numbers in the image indicate cell cycle phase based on bud morphology: 1) G1, 2) telophase/G1, 3) M, 4) early S phase, 5) M and 6) late anaphase. Centromeric clusters in M and late anaphase are brighter than those in G1 or telophase. See Supplemental Figure 1 and Movie S1.

