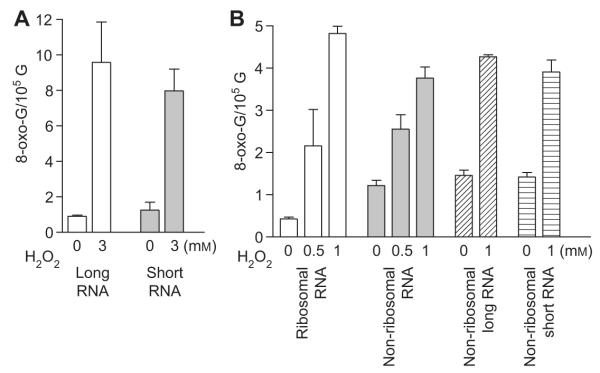
Figure 3.
The levels of 8-oxo-G in various cellular RNA species under normal conditions and in response to H2O2 treatment.
(A) 8-oxo-G levels in long and short RNA fractions of total RNA isolated from cultures that were treated with and without 3 mm H2O2. (B) 8-oxo-G levels in RNA from ribosome, non-ribosome and long and short non-ribosome fractions. Exponentially grown cells were treated with 0.5 or 1 mm H2O2 for 15 min. Various RNA fractions were prepared and 8-oxo-G level was measured as described in Materials and methods. The mean and standard error of triplicates were plotted.

