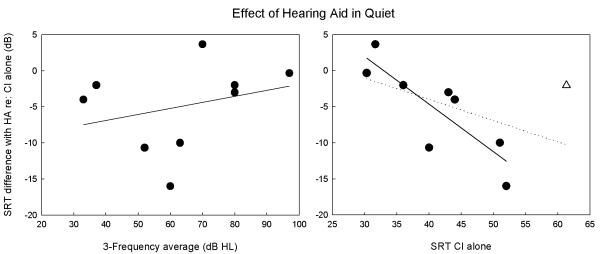
Figure 4.
Difference in SRT between CI+HA and CI-alone in quiet was plotted against 3-PTA in the contralateral ear (left) and CI-alone performance (right). No association was found between SRT difference and 3-PTA. A statistically significant relationship was found between change in SRT and CI-alone performance when an outlying poor CI performer was excluded (r=−.83, slope=−.66, p=.01), as indicated by the solid regression line. The dotted regression line shows the analysis that included the outlying performer, and this correlation was not significant.

