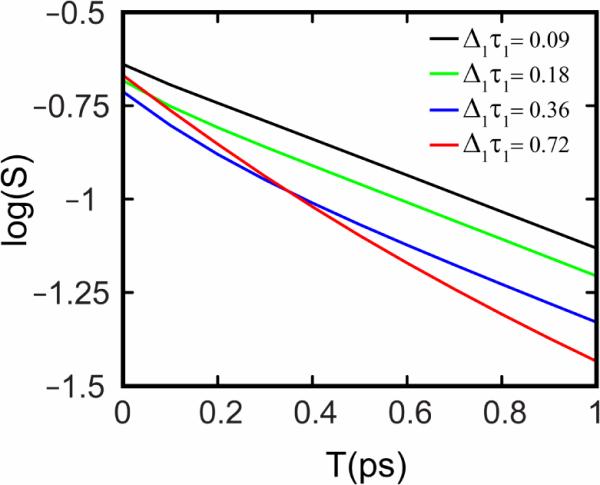
Figure 2.

Log(S), the logarithm of the inverse slope, is plotted vs. waiting time T from simulated 2D IR spectra using different correlation functions. For all the simulations a correlation function of the form was used, where values of Δ1 & Δ2 were taken from the work of Skinner and coworkers[50]. The value of τ2 was set to 2ps (Skinner's value was 0.8 ps) and as τ1 is increased the slope begins to show a biexponential decay.
