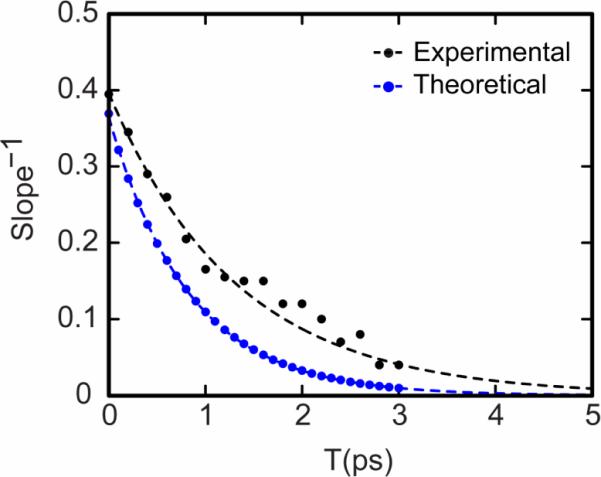
Figure 5.

Experiment (black) and simulation (blue) values for the inverse slope for NMAD in D2O. The simulated slopes were obtained from 2D spectra with response functions as given in Equation 3 and the Appendix along with the frequency-frequency correlation function reported by Skinner and coworkers[50]. The inverse slopes were fitted (dashed lines) to single exponential decays: S(T) = 0.4e−T/1.3ps (for the experiment) and S(T) = 0.37e−T/0.81ps (for the simulation).
