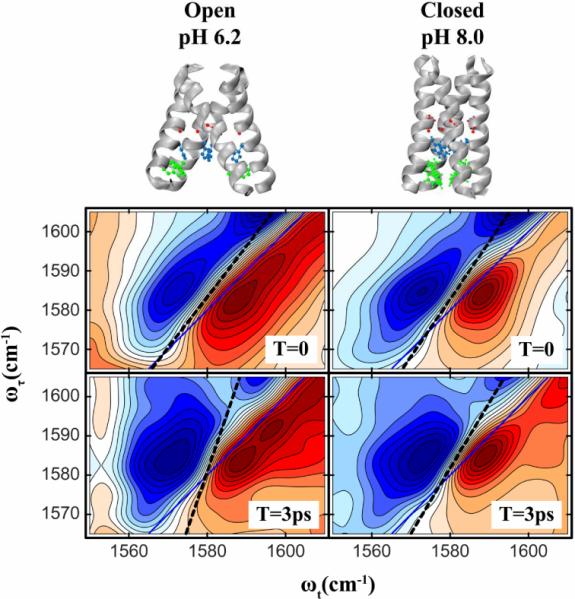
Figure 7.

2D IR spectra of isotopically labeled G34 in the M2TM protein at waiting times 0 and 3ps. Spectra are shown for two pH's : 6.2(left) and 8.0(right) at which the channel is known to be in its `Open' and `Closed' states respectively. The `Open' and `Closed' state structures of M2TM are shown above. The PDB structures 2RLF and 3C9J were used to represent the Closed and Open states respectively. The slopes are drawn in dashed lines.
