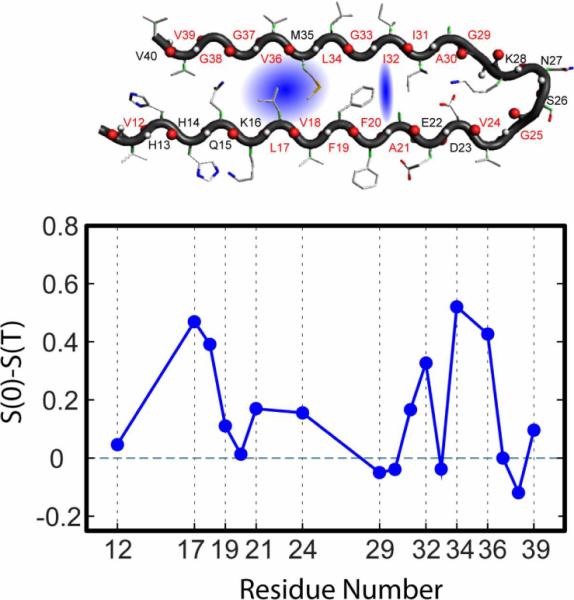
Figure 9.

Top: Cartoon of the amyloid Aβ40 protein with isotopically replaced residues marked in red. Water in the blue shaded region would influence the amide-I spectral densities for the apposed residue pairs L17, V18 and L34. V36. The apposed residues A21 and I32 also show a small effect.
Bottom: Plot of the difference in Inverse Slope from T=0 to T=3ps vs. residue number for the amyloid Ab40 protein. For residues L17, V18, L34. V36, A21 and I32 the slope clearly changes with T suggesting nearby water.
