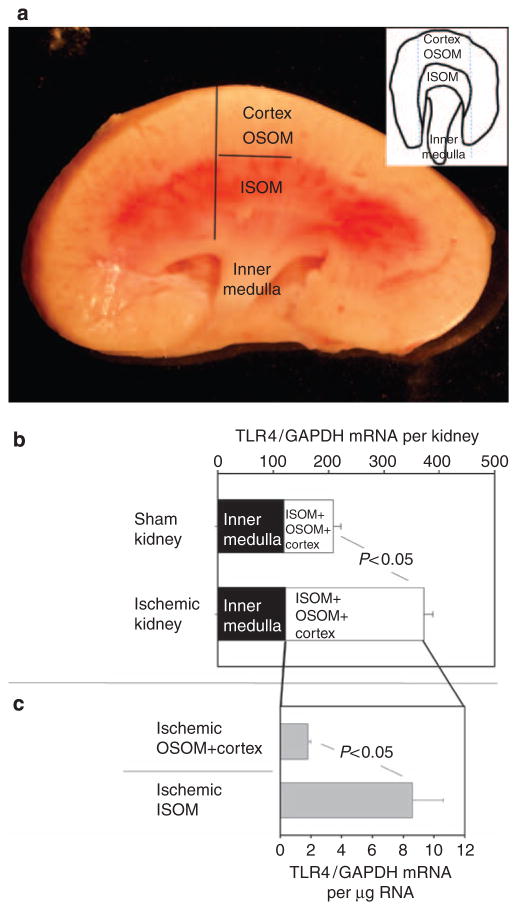
Figure 2. Toll-like receptor 4 (TLR4) expression in regions of the kidney.
(a) Ischemic kidney. The kidney has been dissected along its long axis and the dark lines show how the (OSOM + cortex) may be dissected from the congested (red) inner stripe of the outer medulla (ISOM), and the ISOM from the inner medulla (papilla) as described in the text. The inset shows a kidney cut along its short axis and the dotted lines show how the (OSOM + cortex) was dissected from the ISOM from this view. (b) Ischemia increases TLR4 mRNA in the (ISOM + OSOM + cortex) but not in the inner medulla. The x axis is the TLR4 mRNA determined by quantitative reverse transcription (qRT)-PCR with the Ct normalized to GAPDH Ct. This value is further adjusted to take into account the fact that the inner medulla comprised 3±1% (n =3, mean±s.e.) of the total mass of the kidney. We assumed uniform distribution of GAPDH throughout the kidney; therefore, the values displayed on the x axis for the inner medulla are 3 × dCT (TLR4/GAPDH), and that for the ISOM + OSOM + cortex is 97 × dCT (TLR4/GAPDH). (c) Greater TLR4 expression in the ischemic ISOM compared with the (OSOM + cortex). The x axis is the TLR4 mRNA determined by qRT-PCR and the comparative Ct method. TLR4 Ct is normalized to the GAPDH Ct. The calibrator gene is TLR4 in the ischemic OSOM + cortex. Each value shown in b and c is the mean ± s.e. of six determinations. P<0.05 between sham and ischemic kidneys in b, and between ISOM and (OSOM + cortex) in c. OSOM, outer stripe of the outer medulla.

