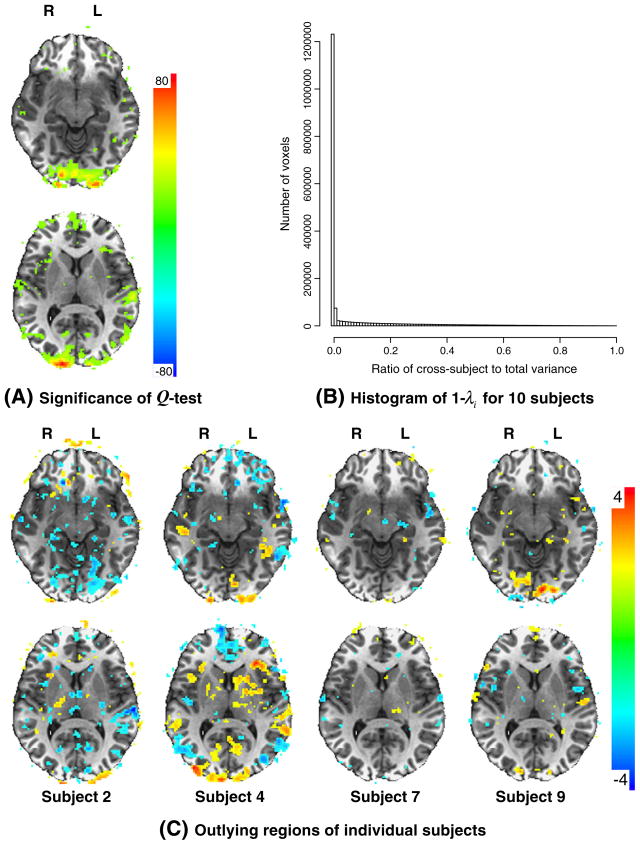
Fig. 4.
Outlier detection with MEMA. (A) Homogeneity of subjects (τ2=0) under Gaussian distribution assumption for cross-subject random effects can be tested with Q-test (8) with a χ2-distribution. (B) Histogram of cross-subject relative to the total variance among 1,829,050 voxels (resolution 2×2×2 mm3) in the brains of 10 subjects. The number of cells at the x-axis is 100 with a resolution of 0.01 for the variance ratio. The cross-subject variance τ2 is estimated with REML (14). (C) The Wald test Oi result for four subjects in outlier identification is shown. In both (A) and (C) the upper panel (Z=59) shows the visual cortex region in axial view while the lower panel (Z=74) focuses on the STS. One-tailed significance level was set at 0.05 without cluster thresholding.

