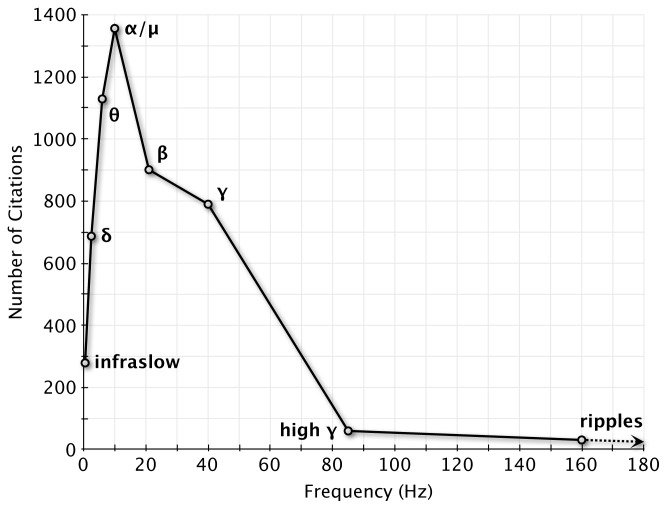
Fig. 1.
EEG/MEG citations in PubMed since 2007, visualized as a spectrum across frequencies. Number of citations were plotted as a function of frequency band centers, using the following definitions. Infraslow: 0.01–1 Hz, δ: 1–4 Hz, θ: 4–8 Hz, α/μ: 8–12 Hz, β: 12–30 Hz, γ: 30–50 Hz, high-γ: 50–120 Hz, and ripples: 120–200 Hz.

