
Fig. 4.
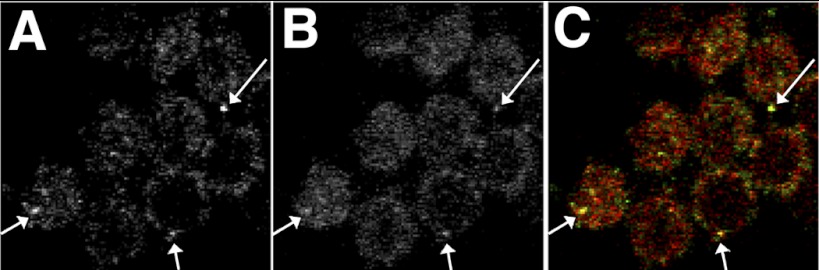
Rack1 and Slo are colocalized on the surface of hair cells. Shown are confocal images of tall hair cells from chick cochlea fixed and labeled with anti-Slo and anti-Rack1 antibodies viewed in the X-Y plane. Slo channels (A) are clustered on the surface of hair cells, where they colocalize (arrows) with Rack1 (B). C: merged images. Mean fluorescence intensity of RACK1 and Slo were 21.2 ± 4.1 SD and 14.4 ± 2.0 SD (arbitrary units), respectively. Colocalization analysis using JACOP plugin in ImageJ gave a Pearson's Coefficient (r) of 0.738 (0.0 below thresholds determined by Coste's automatic thresholds); Manders M1 and M2 coefficients of 0.951 and 0.961, respectively; and Li's intensity coefficient correlation of 0.295, all consistent with highly significant colocalization.