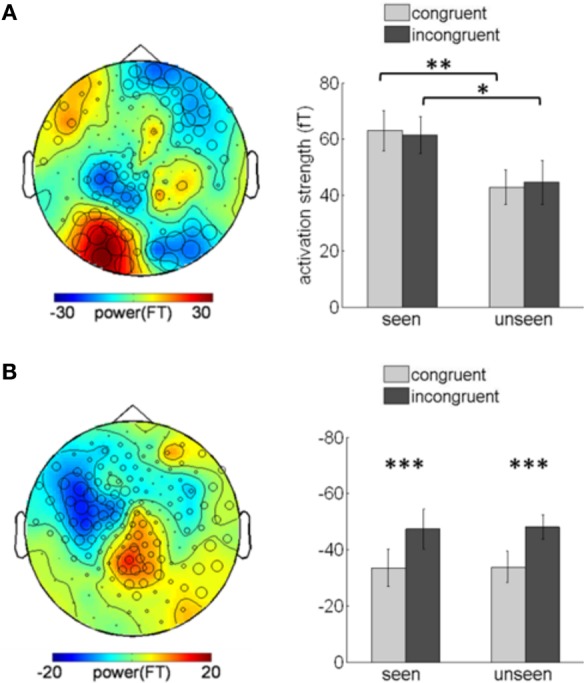
Figure 3.

Awareness and color-congruency related clusters. (A) Awareness-related effects. Left, topographic map of the difference between seen and unseen gratings, averaged over the 130–350 ms time window. Sensors recruited in the significant awareness-related cluster are indicated by an open circle whose diameter is proportional to the time during which the sensor is involved in the cluster. The maximal difference is observed over occipital sensors. Right, bar graph of activation strength in the awareness-related cluster, plotted separately in the four conditions of interest. A significant awareness effect is observed both in congruent (paired t-test, **p < 0.01) and incongruent (*p < 0.02) trials. (B) Congruency-related effect. Left, topographic map of the difference between congruent and incongruent trials, averaged over the 130–350 ms time-window and distribution of the sensors involved in the congruency-related cluster. The maximal difference is located over left parietal and central sensors. Right, bar graph of the cluster activation strength, plotted separately in the four experimental conditions. A significant difference between congruent and incongruent trials can be observed no matter whether the subject reported seeing the grating or not (paired t-tests, congruent vs. incongruent, ***p < 0.001). Error bars indicate standard error of the mean.
