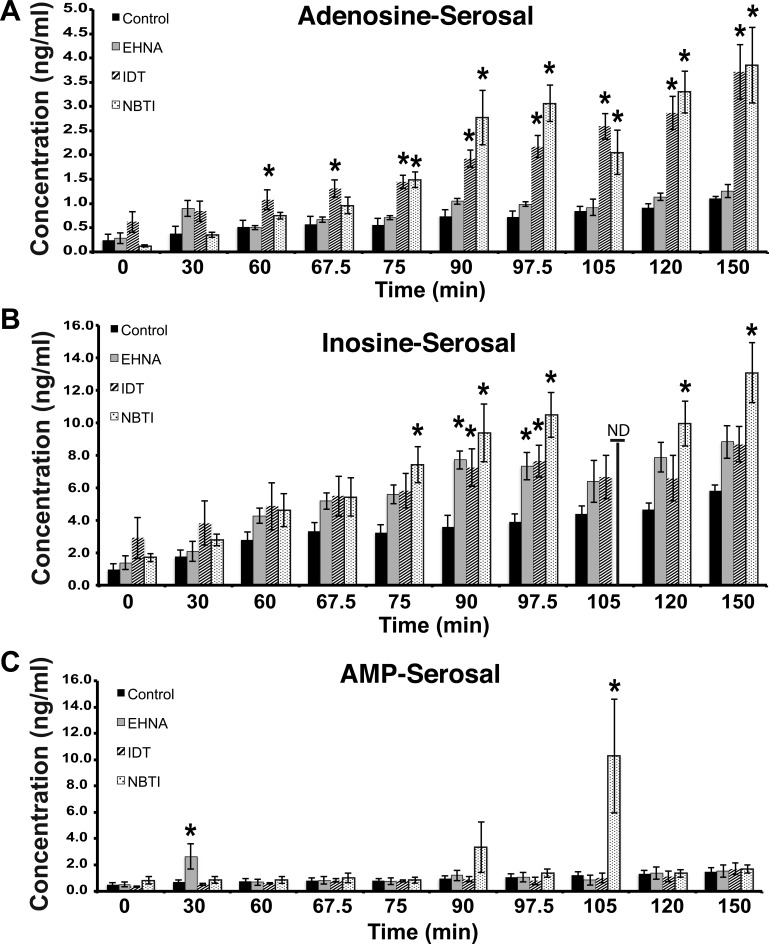
Fig. 2.
Adenosine turnover at the serosal surface of the uroepithelium. A–C: tissue was treated as in Fig. 1, but samples were taken and analyzed from the serosal surfaces of the tissue. The data are expressed as means ± SE (control n = 7, EHNA n = 7, IDT n = 7, NBTI n = 4). *Statistically significant differences (P < 0.05) between control samples and treated ones.

