
Figure 4. Reactivities of residues in β2AR featuring conformational rearrangements of classic receptor activation.
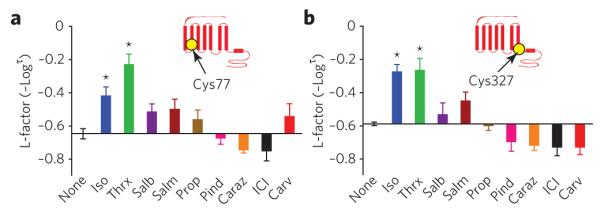
(a,b) effects of nine β2AR ligands on neM reactivity at cys77 (a) and at cys327 (b). insets indicate position of labeled residue in the β2AR snake-like diagram. bar graphs depict the reactivity of each site with the different ligands bound to the β2AR, indicated on the y-axis by l-factor values relative to the value for receptor without ligand. bars extending below the x-axis indicate lower l-factors, and bars extending above it indicate higher l-factors relative to the receptor without ligand. All l-factors shown are for the fast phase. data correspond to the means ± standard errors of at least three independent experiments. Asterisks indicate statistical significance (*P < 0.05) compared to control receptor alone by one-way AnovA.