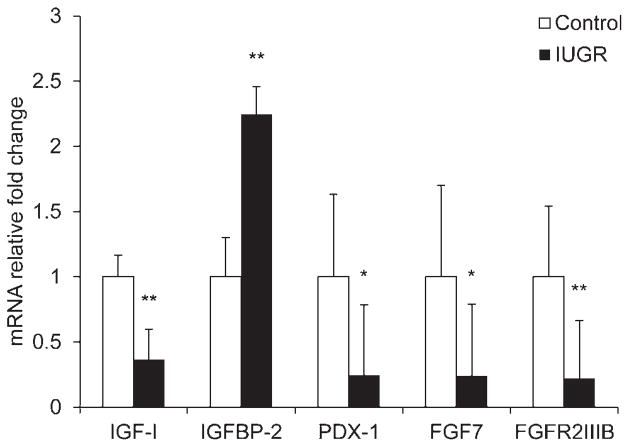
Figure 1.
Pancreas expression profiles for IGF-I, IGFBP-2, PDX-1, FGF7 and FGFR2IIIB. Relative mRNA concentrations for the genes listed on the abscissa are normalized to a reference gene (β-actin) and expressed as the fold change from control calculated by the 2−ΔΔCt in pancreatic tissue collected from control (□) and IUGR (■) fetuses. Mean ± SEM values for animals are presented. Significance is indicated by *P < 0.05 and **P < 0.01. IGF-I, insulin-like growth factor I; IGFBP-2, insulin-like growth factor binding protein 2; PDX-1, pancreatic and duodenal homeobox 1; FGF7, fibroblast growth factor; FGFR2IIIB, fibroblast growth factor receptor 2IIIB; IUGR, intrauterine growth restriction

