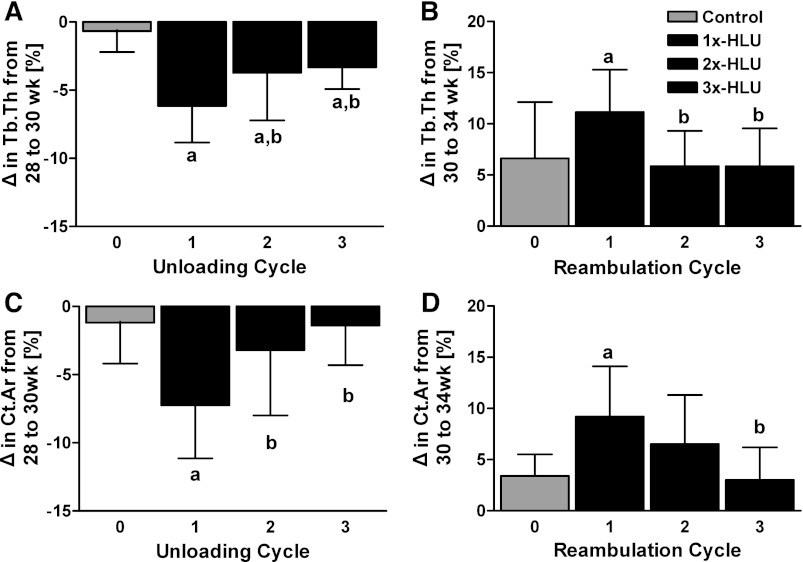
Fig. 4.
Relative changes (means ± SD) measured during the first, second, and third unloading (A, C) and reambulation (B, D) cycle for trabecular thickness (A, B) and diaphyseal cortical area (C, D). The magnitude of the response, measured at the same age across groups, diminished with the number of prior exposures to unloading or reambulation. aAny group different from control. bDifferent from #1 unloading (reambulation) cycle.

