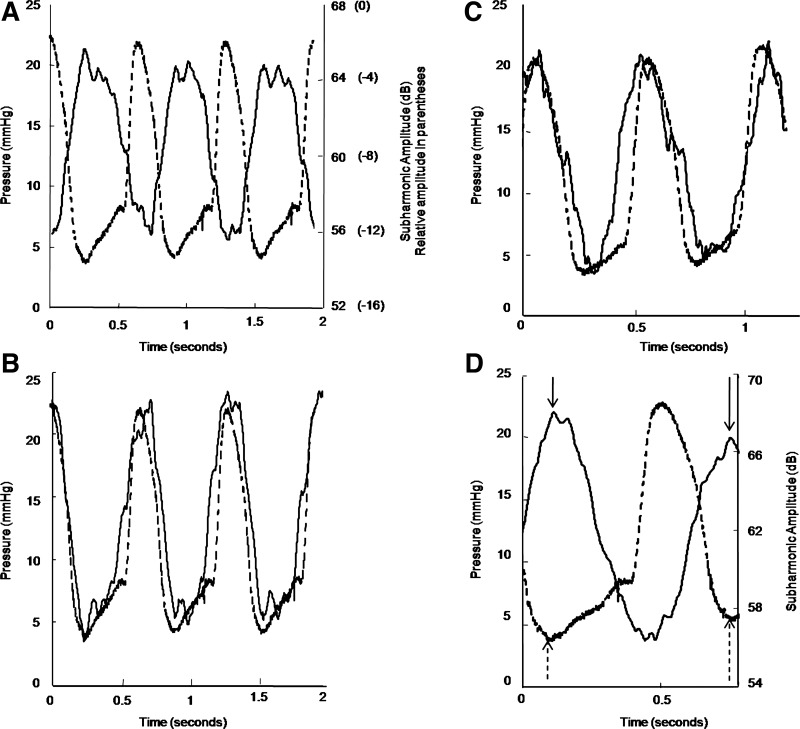
Fig. 3.
RV pressure waveform using subharmonic aided pressure estimation (SHAPE) and the reference standard (manometer catheter). The inverse relationship between the subharmonic signal variation (solid line) and the pressure (dashed line) is shown (A). Sample RV pressure waveforms obtained using SHAPE (solid line) and pressure catheter (dashed line) from 2 canines are depicted in B and C, respectively. The sensitivity of the subharmonic signal (solid line) to changes in the pressure (dashed line) is demonstrated in D; note the decrease in the subharmonic signal amplitude (solid arrows) as the minimum RV diastolic pressure increases (dashed arrows).

