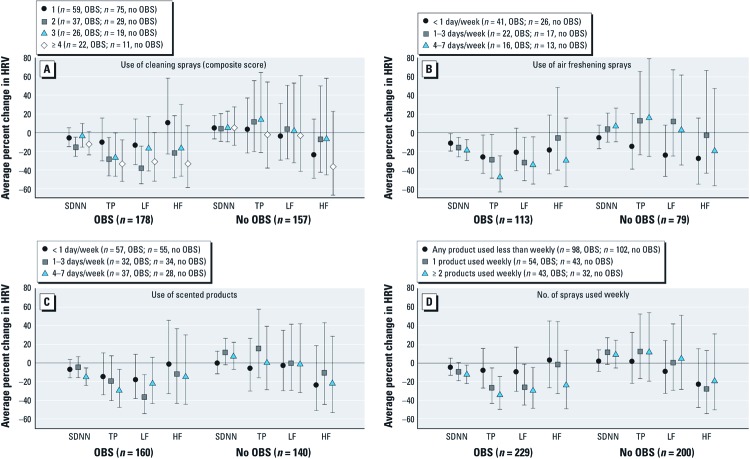
Figure 2.
Adjusted average percent changes (95% CIs) in 24-hr SDNN, TP, LF, and HF associated with the use of cleaning sprays (A), air freshening sprays (B), scented products (C), and the number of sprays used weekly (D) after stratification by OBS. Twenty-four-hour SDNN, TP, LF, and HF were modeled on the logarithmic scale in multiple linear regression as a function of each exposure in separate models and then transformed into average percent change relative to unexposed participants (n = 34, OBS; n = 23, no OBS), after adjusting for OBS, sex, age, age2, BMI, BMI2, alcohol consumption, physical activity, smoking status, environmental tobacco smoke exposure, education, employment status, cardiovascular medication intake, uric acid levels, street and railway noise, traffic-related PM10, seasonal effects and study area. Participants who reported doctor-diagnosed asthma or asthma medication use were excluded from this analysis.

