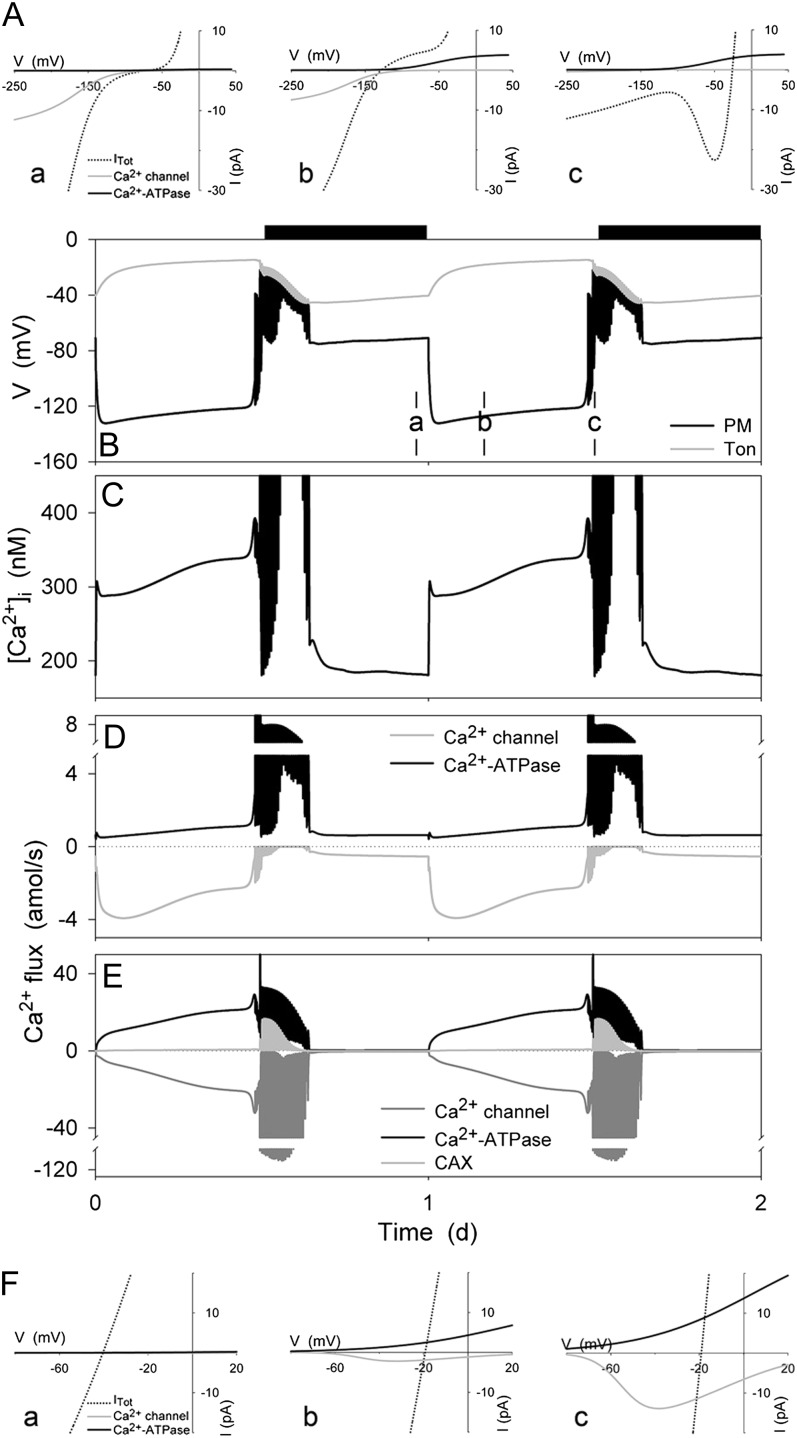
Figure 7.
[Ca2+]i and analysis of the energetics for Ca2+ flux across the plasma membrane and tonoplast resolved over the diurnal Reference Cycle as described in Figure 1 (12 h light:12 h dark, indicated by bars above). Shown in A and F are the current-voltage curves for the dominant Ca2+ transporters at the plasma membrane and tonoplast, respectively. Total membrane current is indicated in each case by the dotted line; the free-running membrane voltage is defined by the point at which this line crosses the voltage axis. Also summarized are the plasma membrane and tonoplast voltages (B), the [Ca2+]i (C), and the Ca2+ channel and Ca2+-ATPase fluxes at the plasma membrane (D) and tonoplast (E). Current-voltage curves are cross-referenced to time points in B to E by letter. Time point b is characterized by plasma membrane hyperpolarization, which favors Ca2+ influx through the Ca2+ channels at the plasma membrane (A); time point c is characterized by plasma membrane depolarization, which favors Ca2+ efflux through the plasma membrane Ca2+-ATPase. Note the difference in scales between D and E, which underlines the predominance of Ca2+ circulation between the cytosol and the endomembrane store of the vacuole. Note that positive flux is defined as movement of the ionic species (not the charge) out of the cytosol, either across the plasma membrane or the tonoplast.

