Fig. 1.
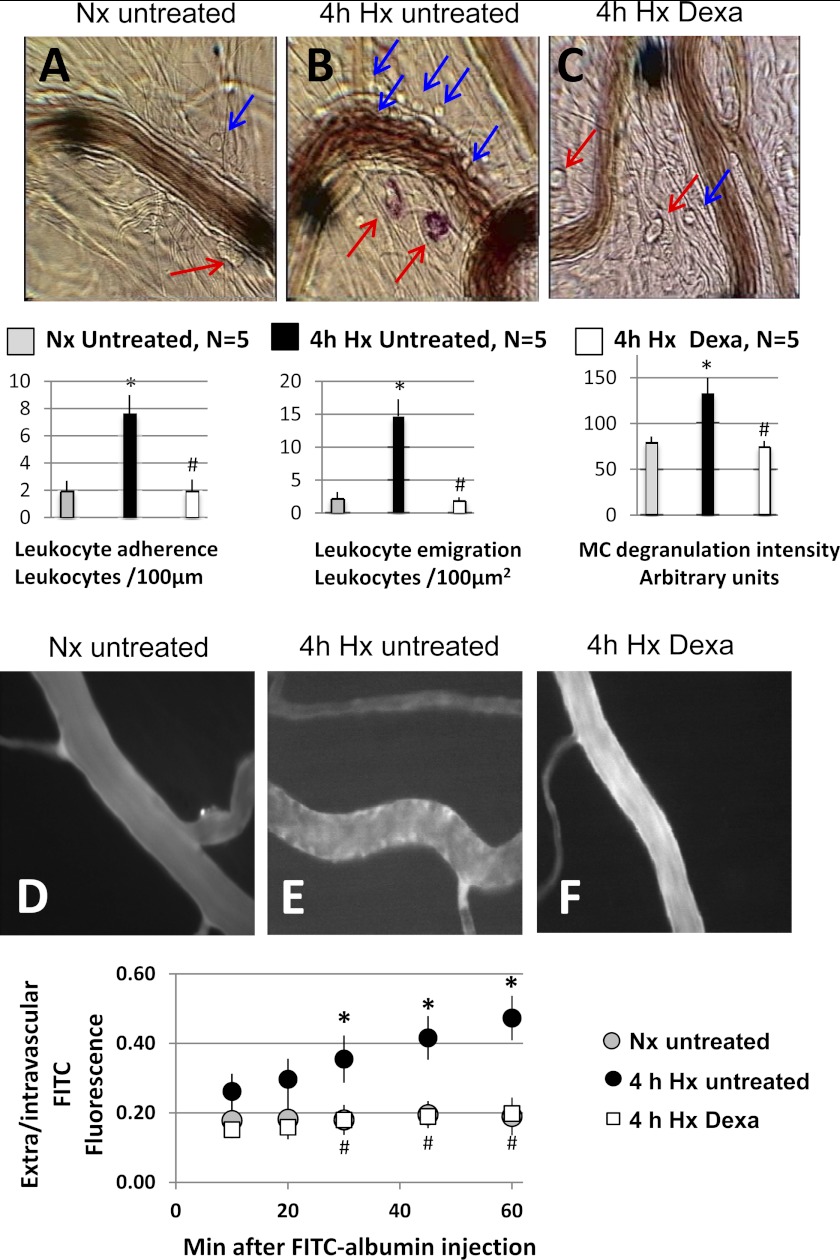
Top: representative bright-field photomicrographs of mesentery postcapillary veins of an untreated rat breathing room air (A) and of an untreated rat (B) and a dexamethasone-treated rat (C) after 4 h of breathing 10% O2 in the conscious state. Blue arrows indicate adherent or emigrated leukocytes, and red arrows indicate mast cells (MCs). The red color of MCs due to uptake of ruthenium red indicates degranulation. The large solid black circles are used to align the optical Doppler velocimeter and occasionally are moved to obtain a better image of the leukocyte-endothelial interface for photographs. The bar graphs below the bright-field images are average data (n = 5/group) of leukocyte-endothelial adherence (left), leukocyte emigration (center), and MC degranulation intensity (right). Bright-field data were obtained 30 min after the postsurgery stabilization period, with the animals in the hypoxia groups breathing 10% O2 continuously. D–F: representative fluorescence images of mesenteric postcapillary venules of an untreated rat breathing room air (D), and of an untreated (E) and a dexamethasone-treated rat (F) after 4 h of breathing 10% O2 in the conscious state. The graph below the fluorescence images depicts the time course of the extravascular-to-intravascular fluorescein isothiocyanate (FITC)-albumin fluorescence intensity ratio after iv injection of the dye in the three groups of rats. Data are mean ± SE of 5 rats in each group. *P < 0.05, 4 h hypoxia (Hx) untreated vs. normoxia (Nx) untreated. #P < 0.05, 4 h Hx Dexa vs. 4 h Hx untreated.

