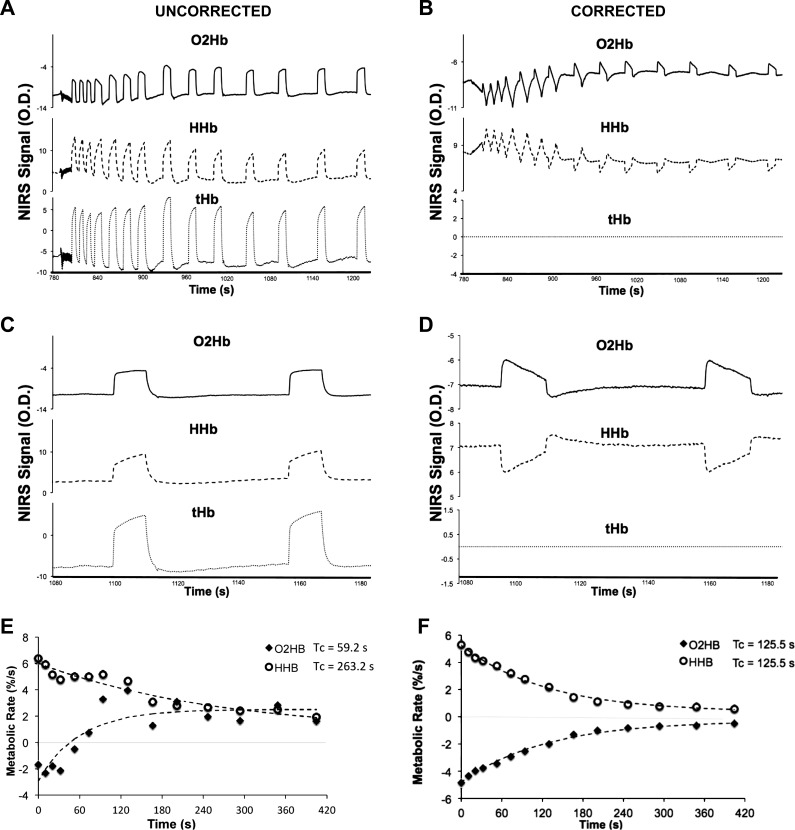
Fig. 3.
Postexercise arterial occlusion data for the oxygenated hemoglobin/myoglobin (O2Hb), deoxygenated hemoglobin/myoglobin (HHb), and the blood volume (tHb) signals for one individual uncorrected (A) and with a blood volume correction (B). Magnification of the final two cuffs for uncorrected (C) and corrected (D) signals are also shown. Monoexponential recovery curves are also shown for uncorrected (E) and corrected (F) data. The correction used was the individualized βi approach (see materials and methods for description).

