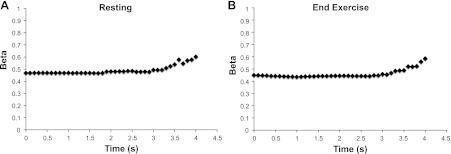
Fig. 5.

Blood volume correction factor (β) calculated for each individual data point over the course a resting arterial occlusion (A) and the first end-exercise arterial occlusion (B). Slope measurements of oxygen consumption were made over the first 3 s. Data presented are the mean changes in β for all individuals and all tests. Error bars were omitted for visual presentation, as β was variable between individuals. Despite individual differences the change in β over time was similar between individuals for resting cuffs (low metabolic rate) and end-exercise cuffs (high metabolic rate).
