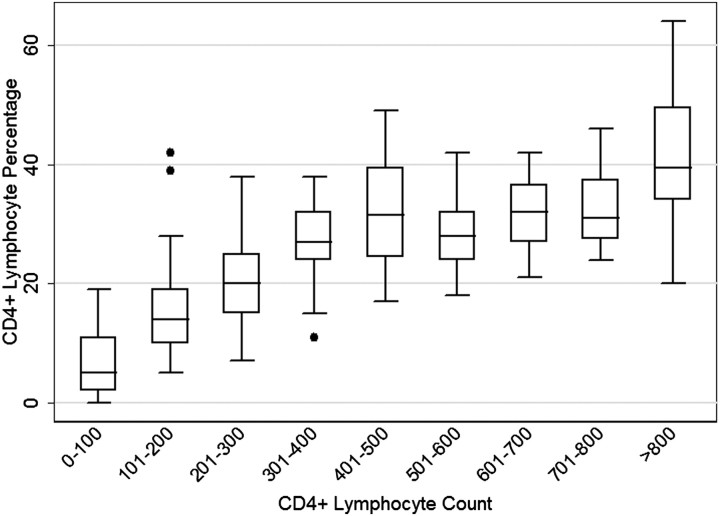
Figure 1.
Boxplots of the distribution of CD4 cell percentages by absolute CD4 cell counts among human immunodeficiency virus–infected participants. The box displays the interquartile range (depicting the 25th and 75th percentiles) surrounding the median value. The whiskers represent values falling within 1.5 times the 25th and 75th percentiles and outliers (solid dots) depict values that fall outside this range.

