
Figure 2.
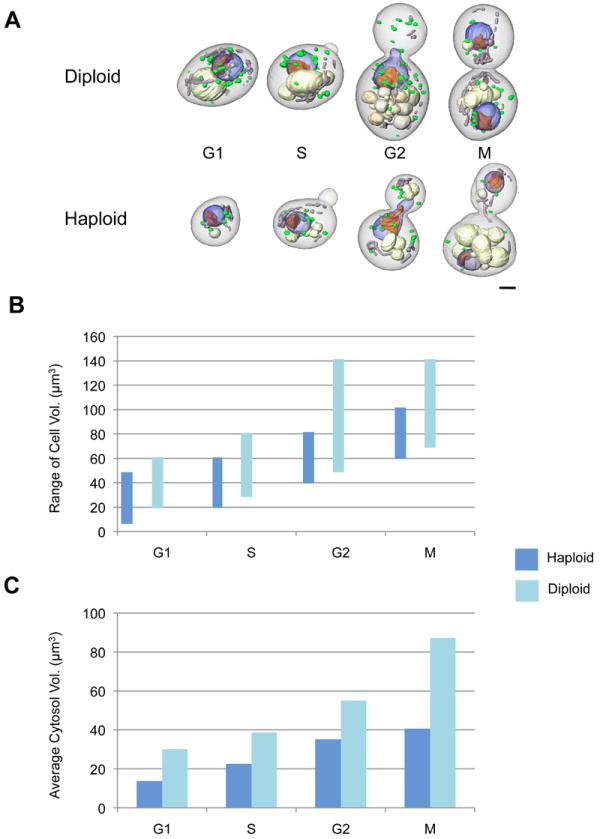
Measurement of cell volumes using segmented cells. (A) Representative haploid and diploid S. cerevisiae cells at the four main stages of cell cycle; scale bar, 1 μm. (B) Comparison of cell volumes in diploid and haploid cells. For this measurement, the total of 74 haploid cells and 80 diploid cells were analyzed. (C) Average cytosolic volume in diploid and haploid cells.