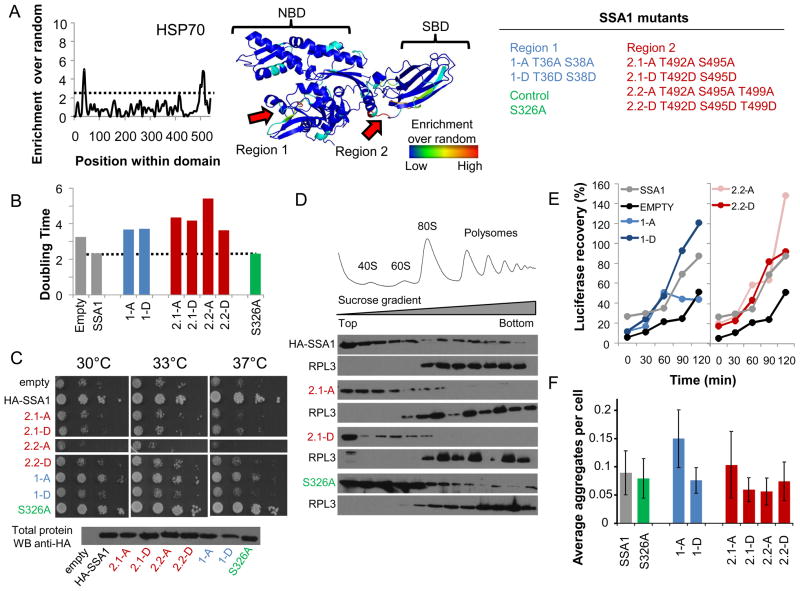
Figure 6. Phosphorylation hot-spots within the HSP70 domain family.
A) A cut-off of p-value<0.005 (dotted line) was used to identify 2 regions that are significantly enriched for phosphosites in the HSP70 family. B) Phosphorylation hot-spot mutants do not complement SSA1 functions as measured by growth in liquid media. C) 10-fold dilution series of Ssa1 mutants on -URA plates and incubated at 30°C, 33°C and 37°C for 2 days. The protein abundance of the different mutants was compared to WT Ssa1 by western. D) The association of the indicated SSA1 mutants with polysomes was examined by immunoblot analysis. Ribosomal profiles (top) were determined by OD254nm and confirmed by immunoblot analysis of the ribosomal proteins Rpl3p. E) Recovery of luciferase activity is expressed as a percentage of activity before heat treatment and is an average of 2 experiments. F) Percentage of cells with multiple and single ubc9-2-GFP aggregates after heat shocked at 37°C for 30 minutes. Errors bars quantify the standard deviations of, at least, 4 technical replicates. See also Figure S4.

