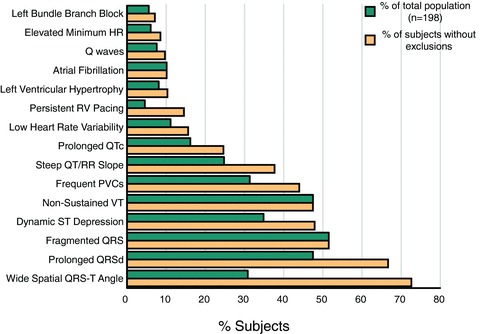
Figure 2.

Prevalence of High‐Risk ECG Parameters in PAREPET Subjects. The prevalence of each of the 15 high‐risk ECG parameters is shown as both a percent of the entire population (green bars, n = 198) and as a percent of those subjects without exclusion criteria for analysis of that particular parameter (gold bars, n = 84–198).
