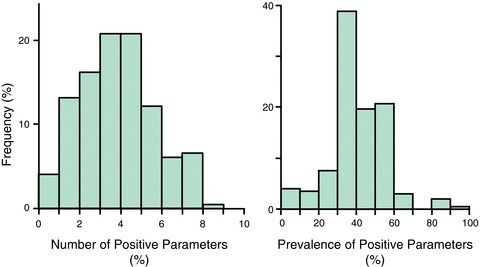
Figure 3.

Frequency of High‐Risk ECG Parameters in PAREPET Subjects. The histogram on the left illustrates the number of positive high‐risk parameters among each of the PAREPET subjects (n = 198). Due to the frequent presence of exclusion criteria there were a variable number of high‐risk ECG parameters that could be evaluated in individual subjects. Therefore, the histogram on the right illustrates the prevalence of high‐risk positive parameters among those that could be assessed in each subject. There were 3.4 ± 1.8 high‐risk ECG parameters per subject, corresponding to a 34% frequency of positive parameters among those that could be assessed.
