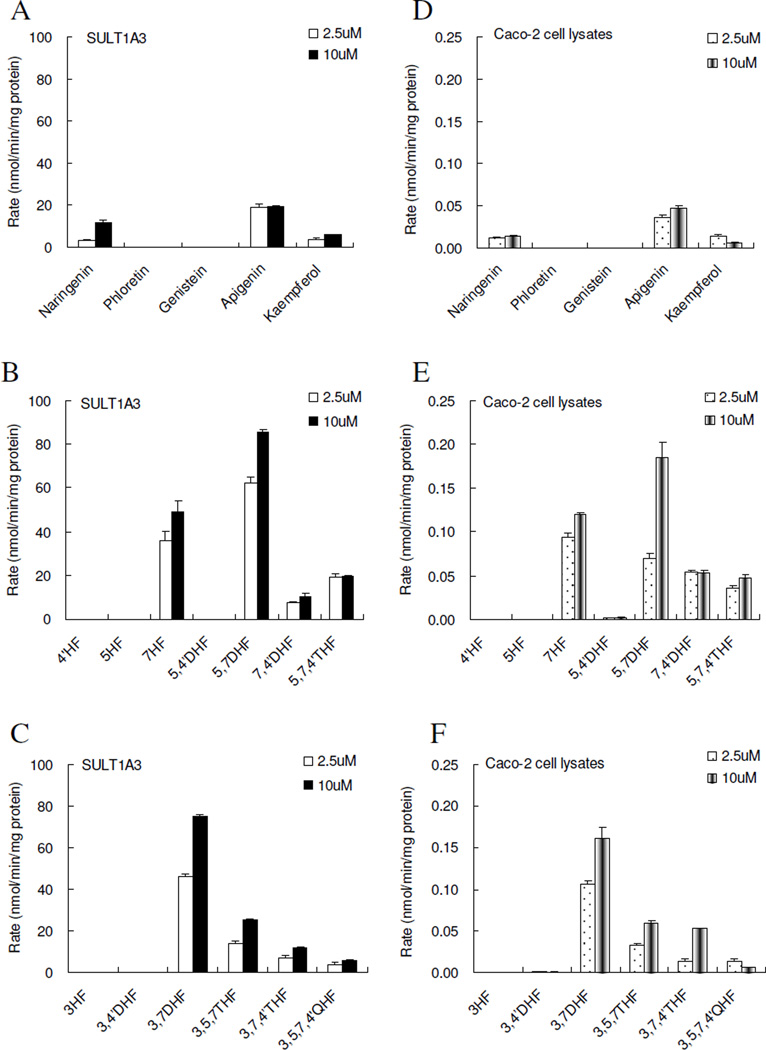
Figure 2. Sulfonation of flavonoids by expressed human SULT1A3 (left three panels) and Caco-2 cell lysates (right three panels).
Flavonoids were from 5 apigenin analogs representing five sub-classes of flavonoids (A, D), 6 flavones (B. E), and 6 flavonols (C, F). Experiments were conducted at the concentration of 2.5 µM (open column) and 10 µM (solid column). Amounts of mono-sulfate(s) formed were measured using UPLC, and quantified using the correction factors shown in Table 2. Rates of sulfonation were calculated as nmol/min/mg of protein. Each bar is the average of three determinations, and the error bars are the standard deviations of the mean (n=3).

