Fig. 2.
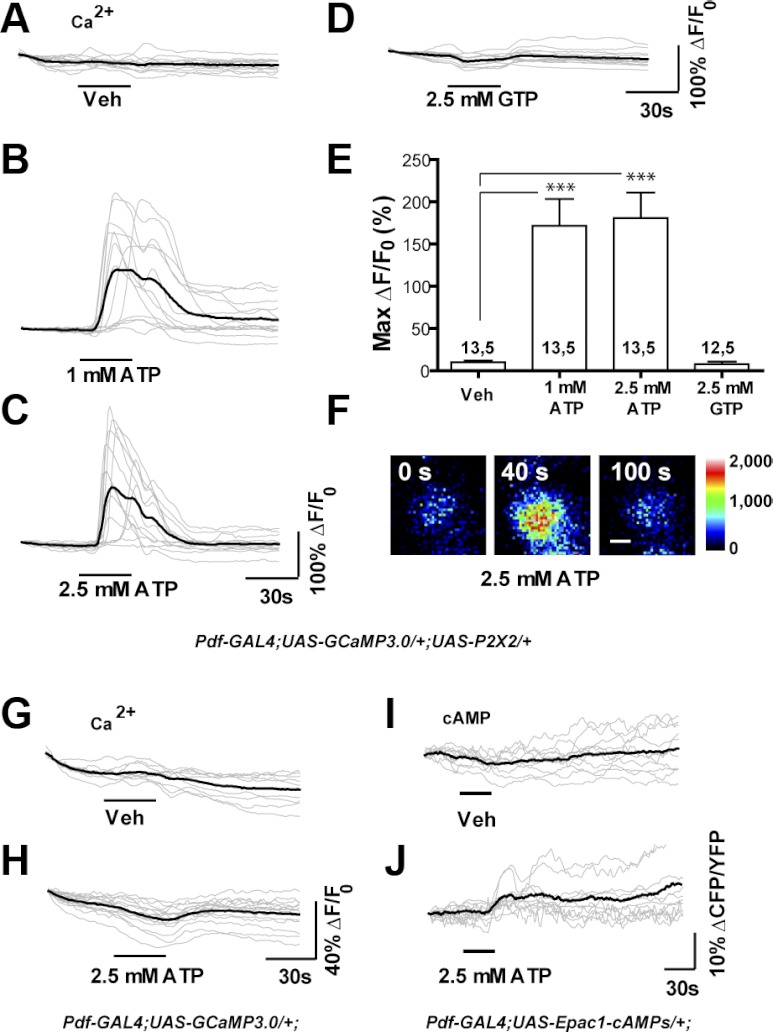
Bath application of ATP results in the excitation of P2X2-expressing deep brain neurons during live imaging experiments. A–D: individual (gray) and mean (black) traces of Pdf(M)-Gal4;UAS-GCaMP3.0/+;UAS-P2X2/+ s-LNv responses to 30-s perfusion of (A) vehicle (N = 13 neurons from 5 brains [13,5]), (B) 1 mM ATP (N = 13,5) (C) 2.5 mM ATP (N = 13,5), and (D) 2.5 mM GTP (N = 12,5). Test compounds were perfused after a 35-s baseline interval and responses were recorded for a total of 150 s. E: histogram summarizing the mean maximum percentage increase in GCaMP3.0 fluorescence displayed by the neurons plotted in A–D. Perfusion of 1 and 2.5 mM ATP caused fluorescence increases that were significantly greater than vehicle control (P < 0.0001, by Mann—Whitney U test). The perfusion of 2.5 mM GTP did not cause significant fluorescence increases relative to the vehicle control (P = 0.6302 by Mann—Whitney U test). The two numbers displayed within or above each bar of the histogram indicate the number of neurons and the number of brains examined, respectively. F: representative intensity mapped micrographs of a single Pdf(M)-Gal4;UAS-GCaMP3.0/+;UAS-P2X2/+ s-LNv before (0 s), during (40 s), and after (100 s) its response to bath-applied 2.5 mM ATP. The scale bar in F = 2.5 μm. G and H: characterization of ATP's P2X2-independent effects on GCaMP3.0 fluorescence: unlike vehicle perfusion (G), 30-s 2.5 mM ATP perfusion (H) caused a slight but consistent decrease in GCaMP3.0 fluorescence. I and J: characterization of ATP's P2X2-independent effects on Epac1-camps inverse FRET levels. Unlike vehicle perfusion (I), 30-s 2.5 mM ATP perfusion caused a slight increase in inverse FRET (J), due to a decrease in YFP emission.

