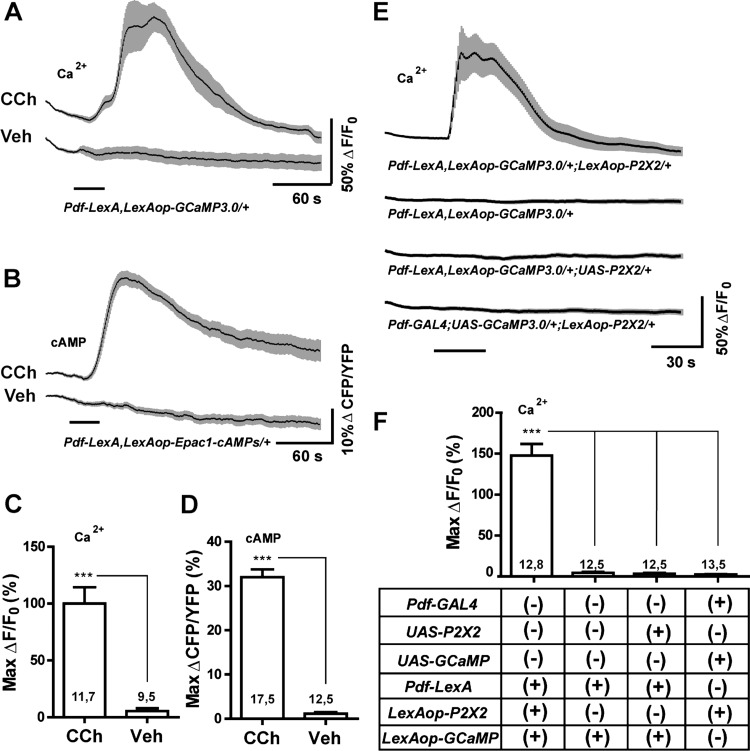
Fig. 3.
LexA operator-driven P2X2 and genetically encoded sensors for excitation and live imaging. A: mean GCaMP3.0 traces for Pdf-LexA(7M),LexAop-GCaMP3.0(4A)/CyO s-LNvs to 30-s perfusions of 10−4 M carbachol (CCh) or vehicle (Veh). B: mean Epac1-camps inverse FRET traces for Pdf-LexA(7M),LexAop-Epac1-camps(1A)/CyO s-LNvs to 30-s perfusions of 10−4 M CCh or Veh. C and D: maximum changes in GCaMP3.0 fluorescence (C) or Epac1-camps inverse FRET increases (D) of s-LNv corresponding to the data in A and B, respectively. Numbers on the histograms indicate the number of neurons and brains sampled. Both LexAop-driven sensors displayed significant responses to CCh relative to Veh controls (P = 0.0004 for GCaMP3.0 fluorescence and P < 0.0001 for Epac1-camps inverse FRET by Mann—Whitney U test). E: mean GCaMP3.0 traces for the s-LNvs of the genotypes indicated below the plots to 30-s perfusions of 10−3 M ATP. Pdf-LexA—driven expression of LexAop-P2X2 rendered s-LNvs sensitive to bath-applied ATP. UAS-P2X2 and LexAop-P2X2 elements did not render neurons sensitive to ATP in the absence of their appropriate Gal4 or LexA drivers. F: summary of maximum Ca2+ responses of s-LNv in E. *** indicates P < 0.001 by Kruskal—Wallis one-way ANOVA and a Dunn's multiple comparison test. Numbers on the histogram is in C, D, and F indicate the number of neurons and brains sampled. For A, B, and E, the time of perfusion is indicated by the bars under the plots and the gray-shaded regions surrounding the mean plots indicate SE, as do the error bars in C, D, and F.

