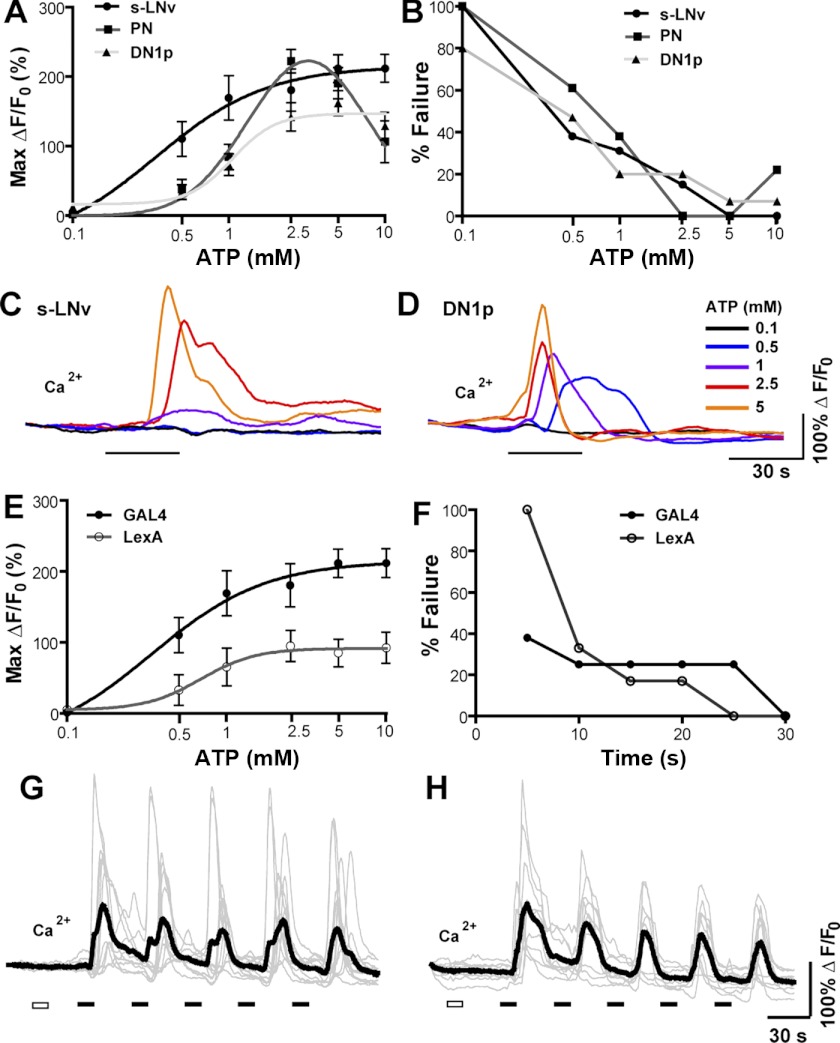
Fig. 4.
Bath-applied ATP reliably and repeatedly activates deeply situated P2X2-expressing neurons in the explanted adult brain. A: dose—response curves for the excitation of P2X2-expressing s-LNvs (N = 13,5), DN1ps (N = 15,5), and olfactory projection neurons (PN, N = 18,5)) by 30-s perfusions of ATP. The genotypes used for each neuronal class where Pdf-Gal4;UAS-GCaMP3.0/+;UAS-P2X2/+ for s-LNvs, ;UAS-GCaMP3.0/+; Clock(4.1M)-Gal4/UAS-P2X2 for DN1ps, and ;Cha(7.4)-Gal4/UAS-GCaMP3.0;UAS-P2X2/+ for PNs. Values represent the mean maximum increase in GCaMP3.0 fluorescence (ΔF/F0) detected during the 150 s following ATP perfusion. B: failure rate curves for 30-s ATP perfusions over a range of concentrations for s-LNvs, DN1ps, and PNs based on the data shown in A. A maximum GCaMP3.0 fluorescence increase of <25% was considered a failure to excite. C and D: GCaMP3.0 responses of a single s-LNv (C) and DN1p (D) cell body to increasing ATP concentrations (0.1–5 mM), each delivered for 30 s. Single neurons displayed graded responses to increasing ATP doses. E: dose—response curves for s-LNv excitation in response to 30-s ATP perfusions comparing s-LNvs from Pdf-Gal4;UAS-GCaMP3.0/+;UAS-P2X2/+ (N = 13,5) and ;Pdf-LexA,LexAop-GCaMP3.0/LexAop-P2X2; (N = 10,5) brains. F: failure rates of s-LNv excitation by various durations of 2.5 mM ATP perfusions comparing s-LNvs excited using the GAL4 (N = 8,5) and LexA (N = 10,5) systems. Genotypes were identical to those used in E. G: individual (gray) and mean (black) GCaMP3.0 traces for repeatedly activated s-LNvs from Pdf-Gal4;UAS-GCaMP3.0/+;UAS-P2X2 brains (N=11,5). H: individual (gray) and mean (black) GCaMP3.0 traces for repeatedly activated s-LNvs from Pdf-LexA,LexAop-GCaMP3.0/LexAopP2X2 brains (N = 10,5). For G and H the white rectangles indicate 30 s of vehicle perfusion and black rectangles indicate 30 s of 2.5 mM ATP perfusion, with 90-s intervals between ATP perfusions.

