Fig. 6.
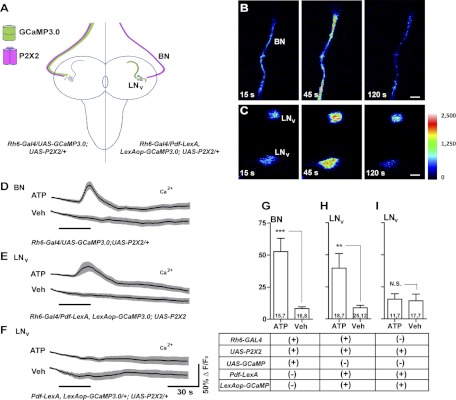
Gal4-based excitation and LexA-based live imaging for an established excitatory connection in the larval brain. A: schematic diagram of Bolwig's Nerve (BN) and larval LNv anatomy. The expression of GCaMP3.0 (green) and P2X2 (magenta) are indicated for two experimental genotypes. B: ATP/P2X2 excitation of BN. Single-plane intensity mapped confocal images of GCaMP3.0 fluorescence in the BN of an Rh6-Gal4/UAS-GCaMP3.0;UAS-P2X2/+ larva before (15 s), during (45 s), and after (120 s) the start of 30-s 5 mM ATP perfusion. C: single-plane intensity mapped confocal images of GCaMP3.0 fluorescence in two larval LNvs of a Pdf-LexA,LexAop-GCaMP3.0/Rh6-Gal4;UAS-P2X2/+ larva before (15 s), during (45 s), and after (120 s) their response to BN excitation. The look-up table represents pixel intensity values for both B and C. D: mean GCaMP3.0 fluorescence traces for BNs of ;Rh6-gal4/UAS-GCaMP3.0;UAS-P2X2/+ larval brains treated with 30-s perfusions (black bar) of 5 mM ATP or vehicle (Veh). E: mean GCaMP3.0 fluorescence traces recorded from the LNvs of Pdf-LexA,LexAop-GCaMP3.0/Rh6-Gal4;UAS-P2X2/+ larval brains in response to 30-s perfusions of 5 mM ATP or Veh. F: mean GCaMP3.0 fluorescence traces recorded from the LNvs of Pdf-LexA,LexAop-GCaMP3.0/+;UAS-P2X2/+ larval brains in response to 30-s perfusions of 5 mM ATP or Veh. For D–F, error bars indicate SE. G–I: summary histograms of the maximum GCaMP3.0 fluorescence increases displayed by the BNs (G) and s-LNvs (H and I) of the genotypes shown in D–F. The two numbers displayed within each bar of the histogram indicate the number of neurons and the number of brains examined, respectively. Asterisks indicate a significant difference in maximum fluorescence increase between ATP and Veh treatments and “N.S.” indicates no significant difference by Mann—Whitney U test (***P < 0.001 and **P < 0.01). The error bars in G represent the SE.

