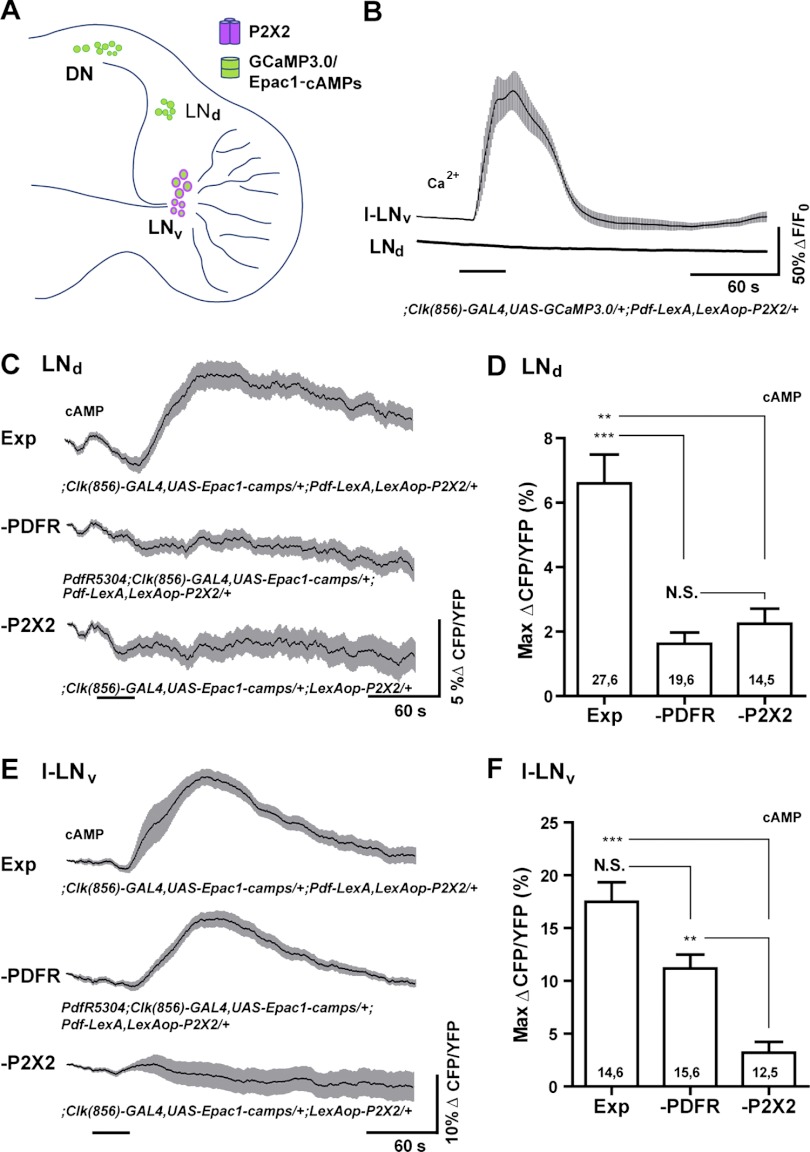
Fig. 7.
LexA-based excitation and GAL4-based live imaging to test a predicted peptidergic connection deep within the adult brain. A: schematic diagram showing the expression of P2X2 and genetically encoded sensors in the experimental brain for testing the predicted physiologic connection between the LNv and the LNd clock neurons. B: mean GCaMP3.0 fluorescence traces of the l-LNvs and LNds during their responses to a 30-s bath application of 1 mM ATP (indicated by the bar under the plots). l-LNv and LNd plots were recorded simultaneously from the same optical sections of a ;Clock(856)-GAL4,UAS-GCaMP3.0/+;Pdf-LexA,LexAop-P2X2/+ brain. Shaded regions surrounding the mean plots indicate SE. Excitation of the LNvs had no measurable effects on GCaMP3.0 fluorescence in the LNds. For l-LNvs, N = 14 neurons from 6 brains (14,6). For s-LNvs, N = 17,6. C: mean Epac1-camps inverse FRET traces of the LNds during excitation of the LNvs in ;Clock(856)-GAL4,UAS-Epac1-camps/+;Pdf-LexA,LexAop-P2X2/+ brains (“Exp”). LNv excitation resulted in increases in cAMP in the LNds. This response was absent in PdfR5304;Clock(856)-GAL4,UAS-Epac1-camps/+;Pdf-LexA,LexAop-P2X2/+ brains (“—PDFR”), which lacked PDF receptor function, and in ;Clock(856)-GAL4,UAS-Epac1-camps/+; LexAop-P2X2/+ brains, which lacked a LexA driver for the P2X2 element (“—P2X2”). D: summary histogram of the mean maximum increases in Epac1-camps inverse FRET for the LNd data shown in C. E: mean Epac1-camps inverse FRET traces for l-LNvs imaged simultaneously with the LNds shown in C. Plots displayed as for C. ATP/P2X2 excitation of the LNvs resulted in cAMP increases in both wild type (“Exp”) and PdfR5304 (“—PDF”) backgrounds. The l-LNvs showed no cAMP increases in response to ATP in the absence of a LexA driver for the P2X2 element (“—P2X2”). F: summary histogram of maximum increases in Epac1-camps inverse FRET for the l-LNv data shown in E. For D and F, the two numbers within or above each bar of the histogram indicate the number of neurons and the number of brains examined respectively. ***P < 0.001; **P < 0.01; NS, nonsignificance by Kruskal—Wallis one-way ANOVA and Dunn's multiple comparisons test. The mean plots in C and E were corrected for spontaneous FRET drift by subtracting the mean inverse FRET traces of l-LNv and LNd neurons from vehicle treated ;Clock(856)-GAL4,UAS-Epac1-camps/+;Pdf-LexA,LexAop-P2X2/+ (“Exp”) brains (see methods for details).

