Fig. 5.
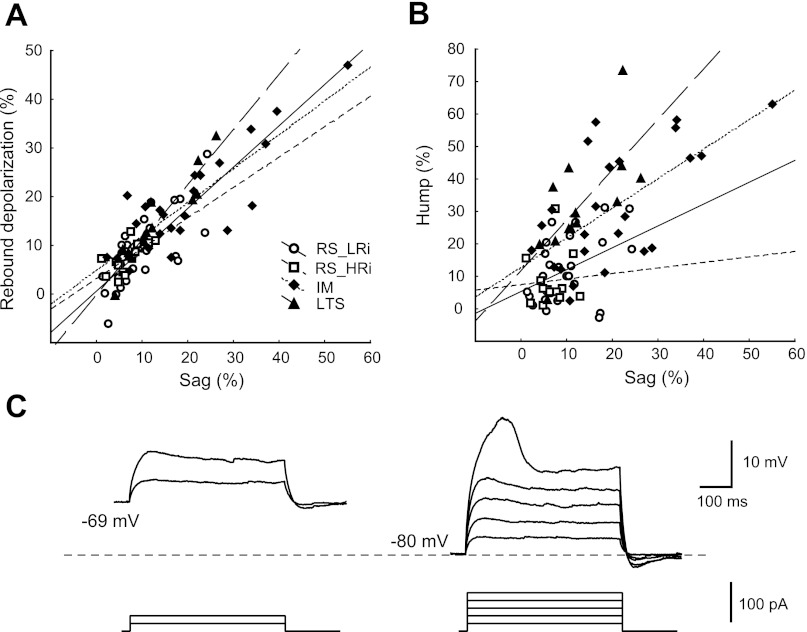
Properties of sag, hump and RD in monkey DLPFC pyramidal neurons. A: sag vs. RD plot indicates a strong correlation (r = 0.86, P < 0.001) between these parameters. B: sag vs. hump plot. Note that the slope of the regression line for sag vs. hump differs between pyramidal cell classes: LTS cells has the steepest slope. Symbols are as indicated in A. C: voltage dependence of humplike depolarization in LTS pyramidal cell. The amplitude of hump increases as the depolarizing current step is applied from more hyperpolarized membrane potentials.

