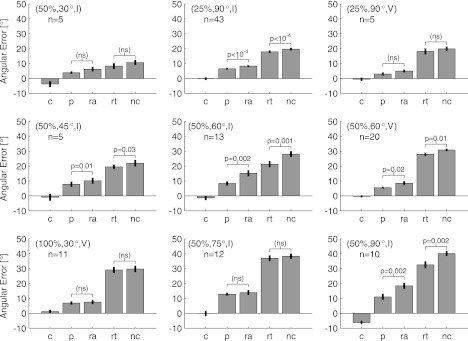
Fig. 14.
Histograms showing the residual angular error predicted from different combinations of re-aiming points and tuning curves, as described in Fig. 13. nc, Error with no compensation; rt, remaining error after re-tuning only; ra, remaining error after re-aiming only; p, error in perturbation session with full compensation; c, error in control session. Each histogram shows data from a different perturbation condition, denoted at top left with the number of experiments (n) run in that perturbation condition.

