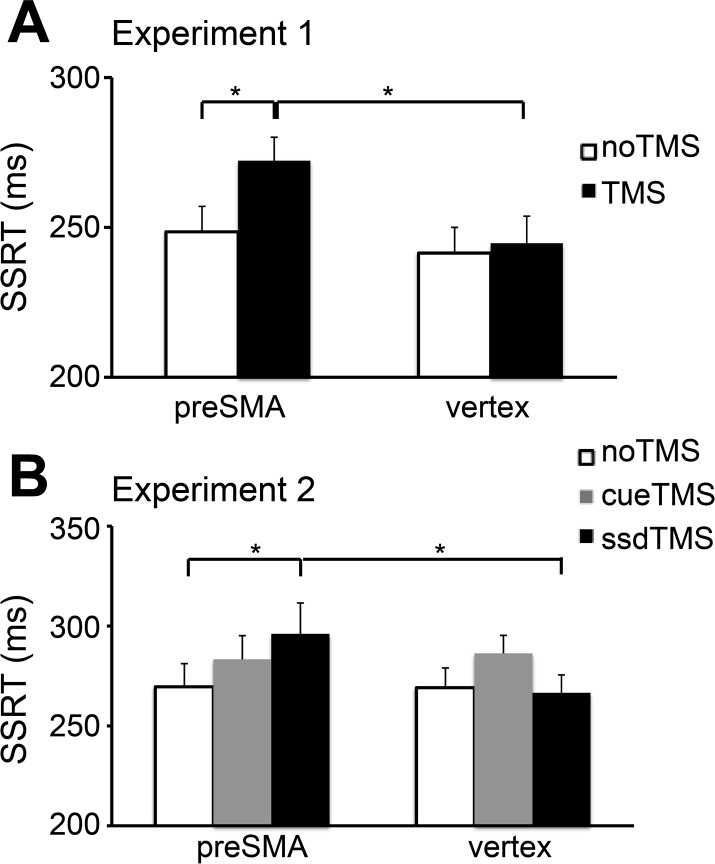
Fig. 2.
A: stop-signal reaction time (SSRT) for the TMS trials was significantly longer than that for the noTMS trials in the preSMA session (P < 0.01) and SSRT for the TMS trials in the preSMA session was significantly longer than that in the vertex session (P < 0.01) in experiment 1. B: SSRT for the ssdTMS trials was significantly longer than that for the noTMS trials in the preSMA session (P < 0.01) and SSRT for the ssdTMS trials in the preSMA session was significantly longer than that in the vertex session (P < 0.05) in experiment 2.

