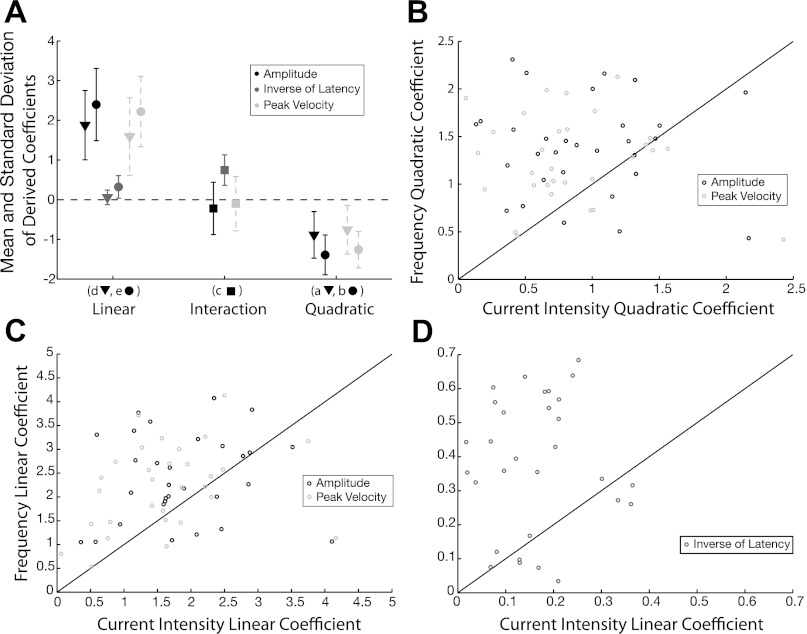
Fig. 4.
Comparison of optimized model coefficients. A: distribution (±1SD from mean) of coefficients from all stimulation sites (n = 30). Mean of quadratic and linear effects associated with current intensity and frequency are shown as triangles and dots, respectively; mean of interaction effect shown as squares. Coefficients derived from amplitude fits shown in black; inverse of latency, gray; and peak velocity, dashed light gray. Association of the symbols to the coefficients of Eqs. 1 and 2 (a, b, c, d, e) shown on x-axis. B: comparison of the absolute magnitude of the quadratic coefficients associated with the current intensity (x-axis) and frequency (y-axis); black circles represent values derived from amplitude fits (n = 30); light gray circles represent values derived from peak velocity fits (n = 30). C and D: comparison of the absolute magnitude of the linear coefficients associated with current intensity (x-axis) and frequency (y-axis); black circles represent values derived from amplitude fits (n = 30); light gray circles represent values derived from peak velocity fits (n = 30); gray circles represent values derived from inverse of latency fits (n = 30).

