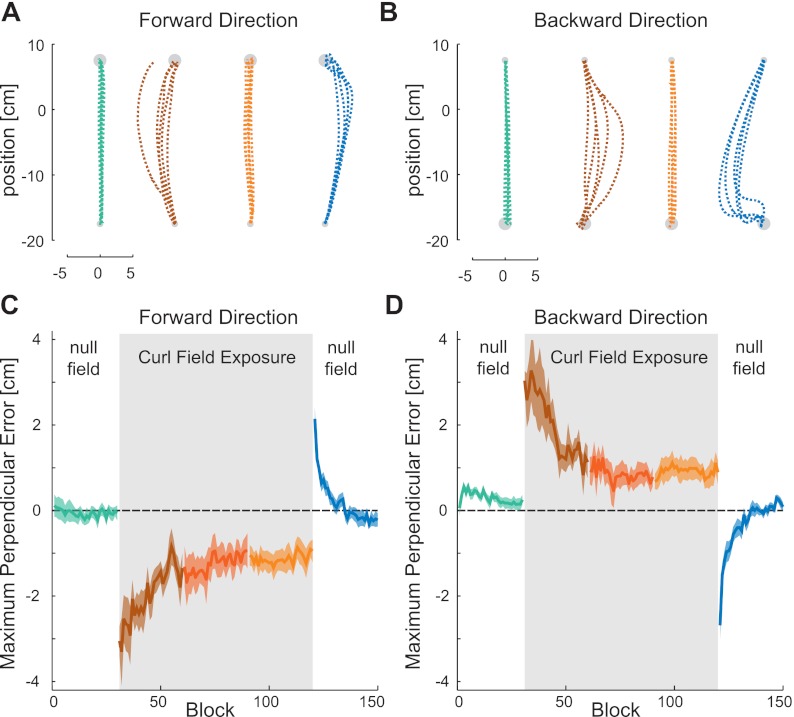
Fig. 2.
Trajectory correlates of adaptation. A: data from one subject showing the forward movement paths in four stages during the learning experiment. The movement paths are shown for the last five movements in the preexposure NF (green), first five movements in the force field (early exposure stage, brown), last five movements in the force field (late exposure stage, orange), and first five movements in the postexposure stage (blue). B: data from one subject showing the backward movement paths in four stages during the learning experiment. C: maximum perpendicular error in the forward direction movements during the five stages of learning: preexposure (green), early exposure (brown), middle exposure (red), late exposure (orange), and postexposure (blue). The sold line represents the maximum perpendicular error across all subjects (mean value across all nonprobe trials within each block of the experiment). The colored shaded region shows the SE. The gray shaded bar indicates the period in which the CF was applied. D: mean values of maximum perpendicular error across all subjects in each block throughout the experiment during movements in the backward direction.

