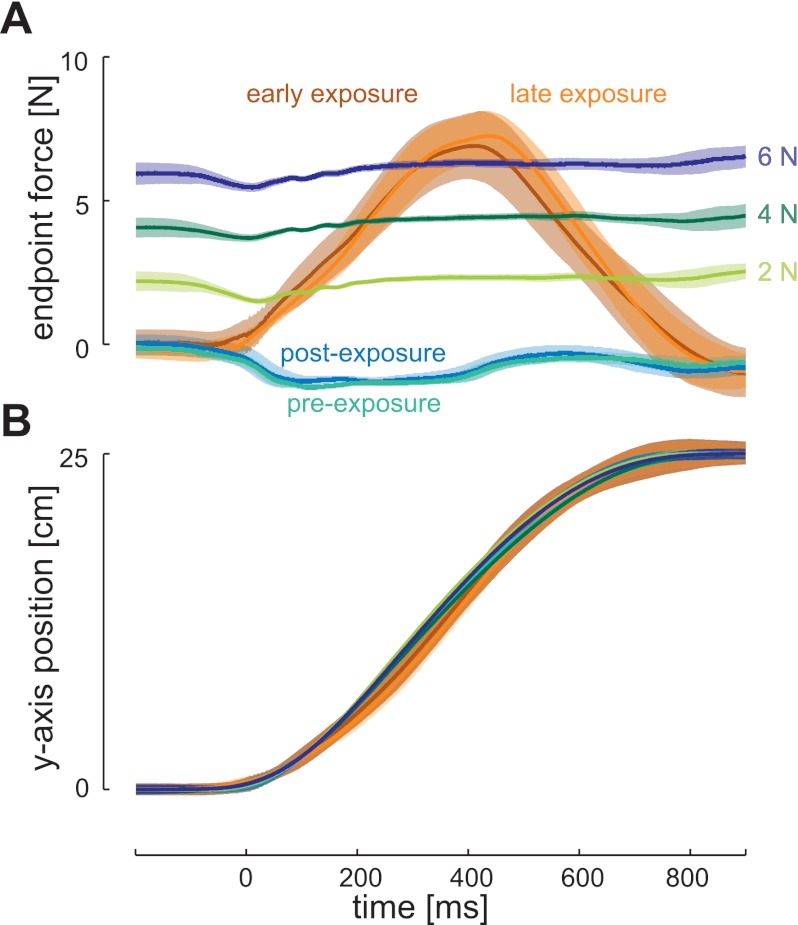
Fig. 6.
Comparison of end point force in the learning and constant background load experiments. A: end point force in the x-axis as a function of time in the NF (preexposure, green; postexposure, blue), CF (early exposure, brown; late exposure, orange), and constant background loads (2 N, light green; 4 N, dark green; 6 N, navy). The solid line indicates the mean, and the shaded region represents the SD of all nonprobe trials within a condition. B: position in the y-axis as a function of time for all of the conditions. Data are shown for a single subject who participated in both experiments.

