Fig. 3.
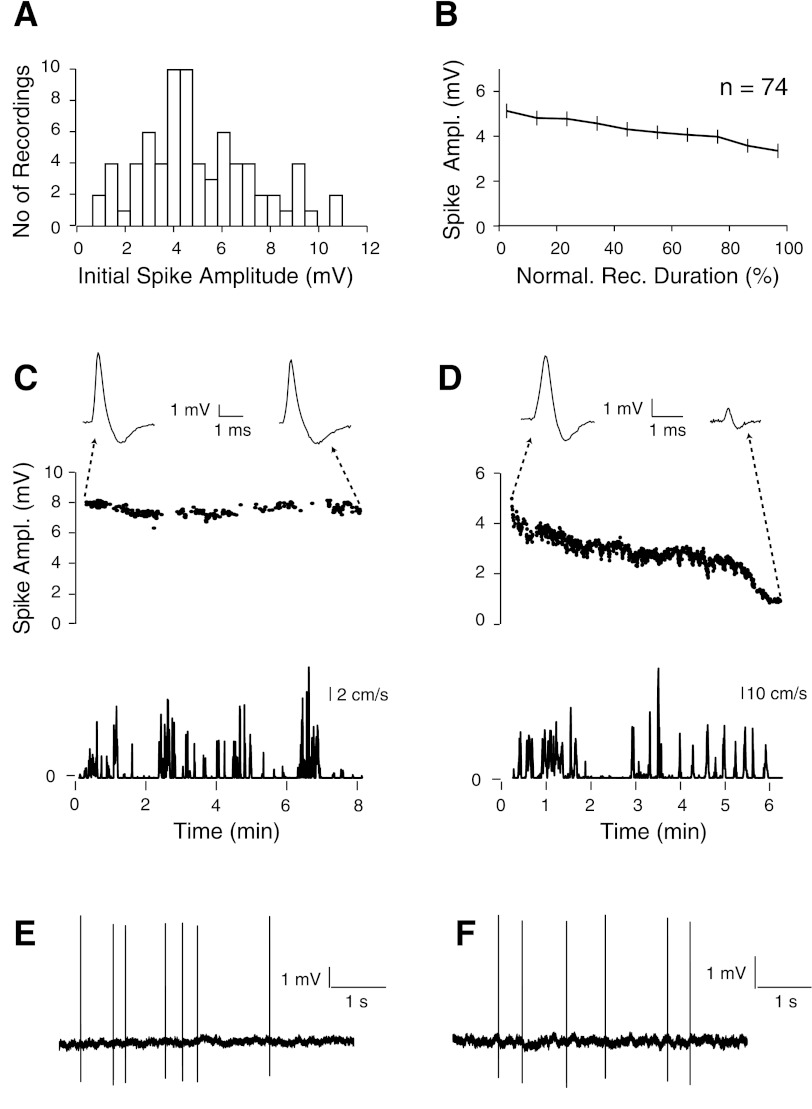
Stability of spike signals during freely moving animal behavior. A: distribution of the initial peak-to-peak spike amplitudes, calculated as the average during the first 10% of each freely moving recording session. B: distribution of spike amplitudes over time for all freely moving recordings. Recording duration was normalized; bin size = 10%. Error bars represent SE. C and D, top: representative recordings where spike amplitudes were either stable (C) or slowly decreased during the freely moving recording session (D). On top, representative spike waveforms from the beginning and the end of each recording session are shown. Bottom: speed plots for the corresponding plots shown above (same timescale). E and F: representative raw spike traces for the recordings shown in C and D, respectively.

