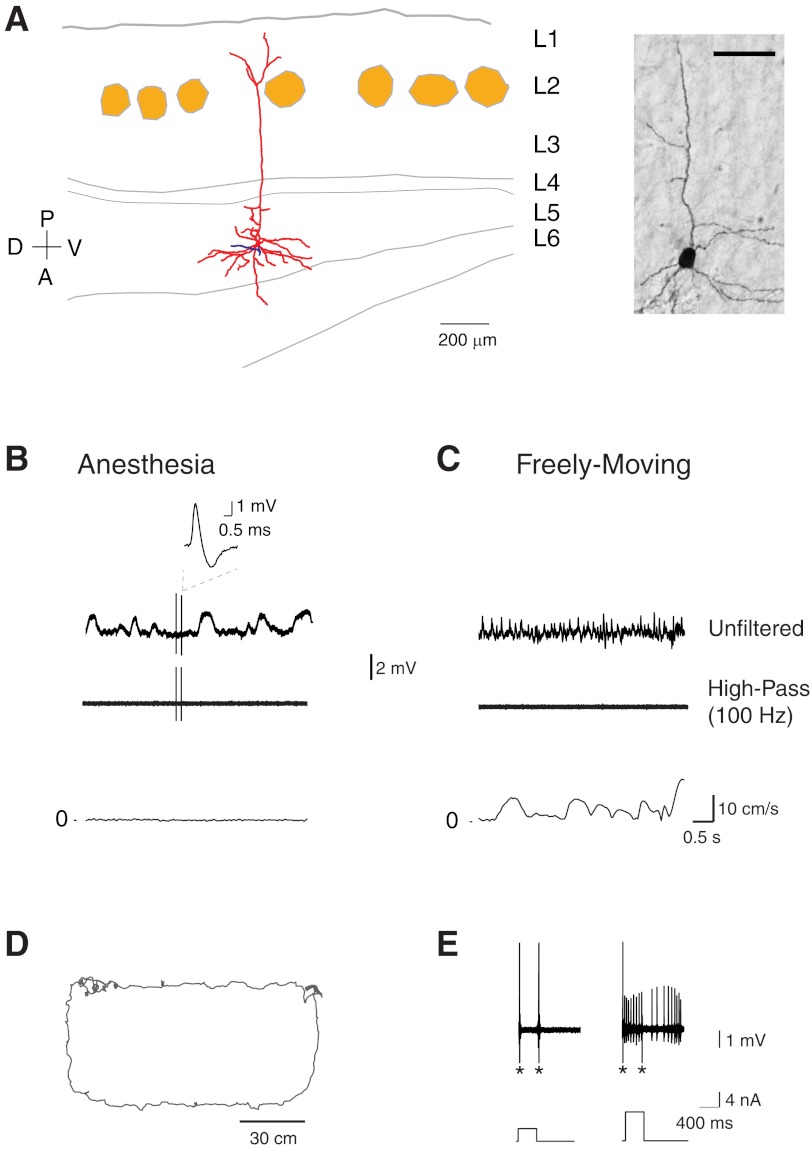
Fig. 5.
Identified silent cells in freely moving animals. A, left: reconstruction of the somatodendritic (red) and axonal (blue) morphology of a layer 5 pyramidal neuron in medial entorhinal cortex with a superimposed outline of small layer 2 patches (light brown) identified by cytochrome oxidase staining. D, dorsal; V, ventral; A, anterior; P, posterior. Right: micrograph of the biocytin-labeled neuron reconstructed on left. Scale bar, 50 μm. B, top: representative unfiltered and high-pass-filtered spike traces recorded from the cell shown in A before the animal woke up and explored the arena. A magnification of the spike is shown. Note the slow wave oscillations (∼1 Hz) during anesthesia in the unfiltered trace. Bottom: speed plot corresponding to the traces shown above. C, top: representative unfiltered and high-pass-filtered spike traces recorded during freely moving behavior from the same cell shown in A. Note the faster LFP oscillations compared with the anesthetized period and the absence of spikes. Bottom: speed plot corresponding to the traces shown above. D: trajectory of the rat (gray) during running in a 120 × 60-cm “O”-shaped maze. E: action potential firing (top) induced by squared current pulses of increasing amplitude (bottom) for the cell shown in A. These pulses were delivered at the end of the freely moving recording session to confirm the presence of the silent cell. Note that this cell kept discharging after the current pulse. Asterisks indicate stimulation artifacts (truncated for display purposes).

