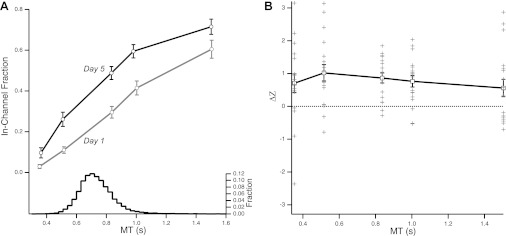
Fig. 3.
Improvement in performance after training. A: proportion of within-channel movements on day 1 (gray) and day 5 (black), plotted as a function of test movement time (MT). The testing session days (days 1 and 5) occurred a day before and a day after the 3 training days, respectively, for all subjects. Subjects were required to move in five different MT ranges. The x-axis shows the average MT value achieved by subjects for each imposed MT range. The histogram indicates the average distribution of movement times during training (collapsed across the 3 days of training). The traces represent speed–accuracy trade-off functions (SAF). There is a change in the SAF before and after training, manifested as improved performance (greater rate of successful movements) at all MTs. Note that improvement is observed at speeds that were not experienced during training (generalization). Error bars denote SE. B: logit-transformed change in performance (Δz) as a function of MT. Solid line indicates average Δz; gray markers indicate performance of single subjects. All average values of Δz are >0, indicating global improvement in accuracy.

