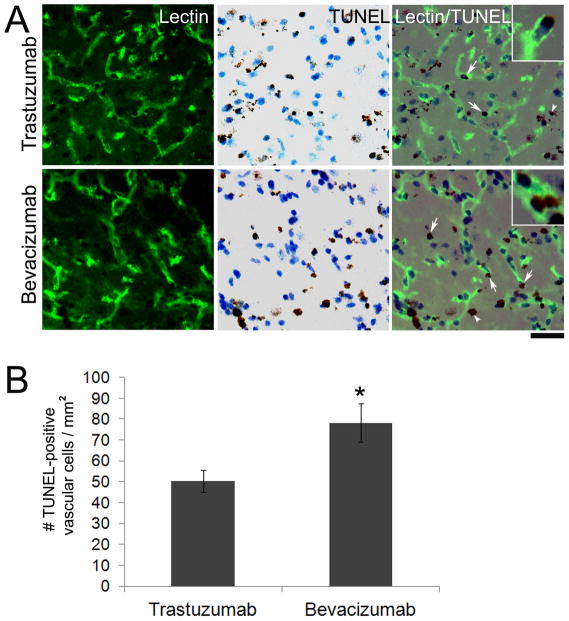
Figure 4.
Bevacizumab treatment increased TUNEL-positive cells on vessel wall. (A) Representative images show sections double stained with lectin (green, left), TUNEL (brown, middle), and merged (right). The bevacizumab treated group had more TUNEL-positive vascular cells (arrows) as compared to trastuzumab. A few TUNEL-positive cells were not associated with a vessel (arrowheads). Insets are high magnification images showing TUNEL-positive nuclei co-localized with lectin. Scale bar: 50 μm. (B) Bar graph shows quantification of TUNEL-positive vascular cells (*p=0.03).

