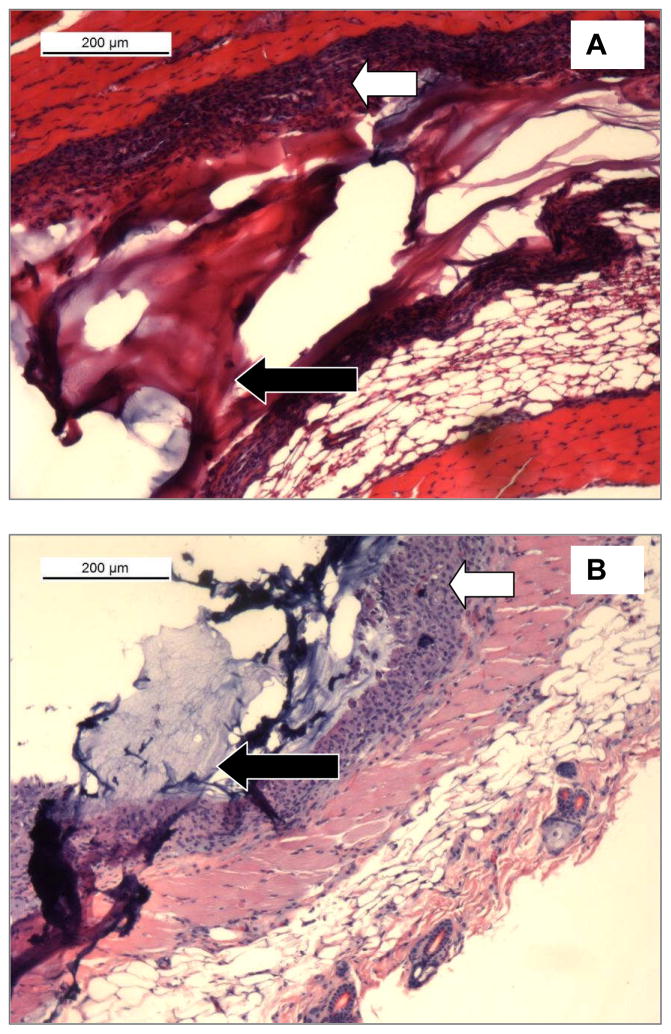
Figure 8.
Analysis of tissue samples subcutaneously injected with A. - CoSeal or B. - 5% silk containing samples two weeks post-procedure. Black arrows indicate the injected material. White arrows indicate similar levels of fibrosis in the two samples, consistent with previously reported data on CoSeal 10.

