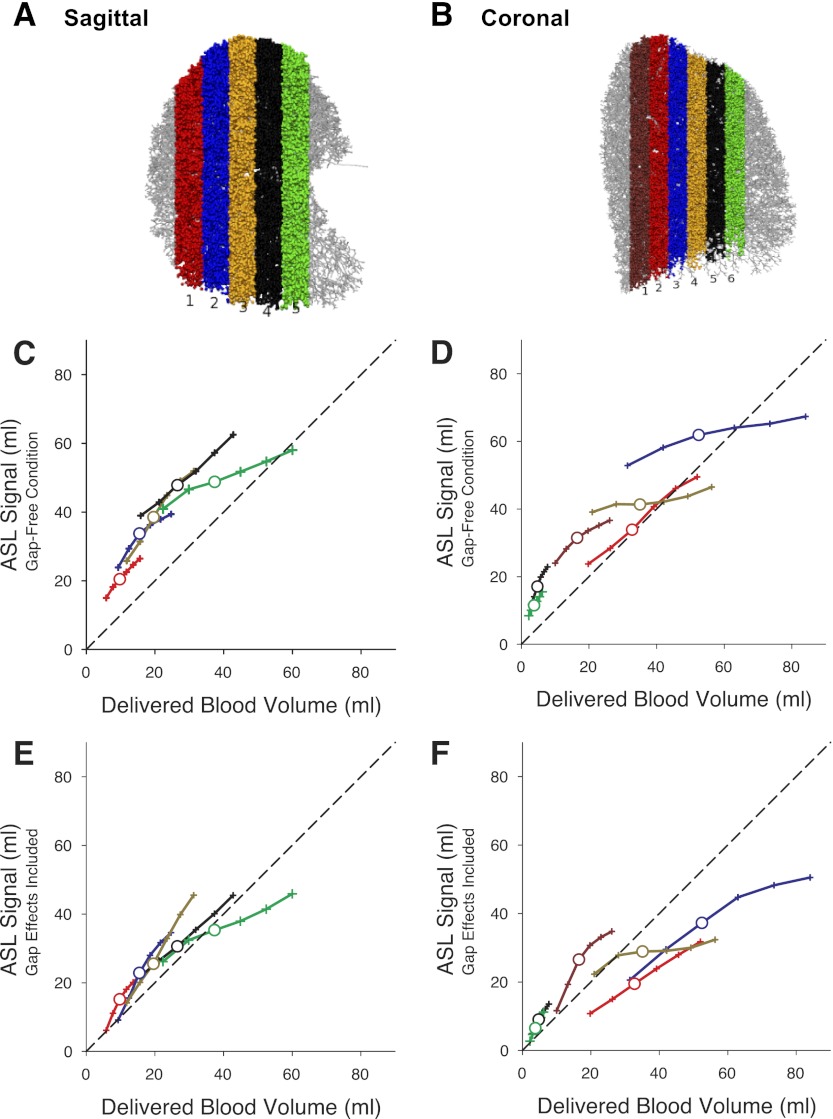
Fig. 2.
Location of the image planes (A and B). Observed ASL signal from a given image plane plotted as a function of arterial blood delivered to that plane in the absence of a gap is plotted in C and D. ASL signal observed in the presence of a gap as a function of arterial blood delivered to the plane is plotted in E and F. Larger symbols in C–F show the results for a typical total arterial blood delivery of 83 ml (corresponding to a cardiac output of 5 l/min at 60 beats/min). Small symbols on each line show the simulation when the cardiac output was increased (to 8 l/min maximum) or decreased (to 3 l/min minimum) from the reference condition of 5 l/min in steps of 1 l/min. In the sagittal plane, the ASL signal when the effect of the gap is included was 64–74% of the possible signal and there was little effect of the position of the image plane location. In the coronal plane the observed ASL signal when including the effect of the gap is more variable ranging from 53 to 84% of the gap-free condition with the most posterior plane (coronal-1) having the least signal loss.

