Fig. 3.
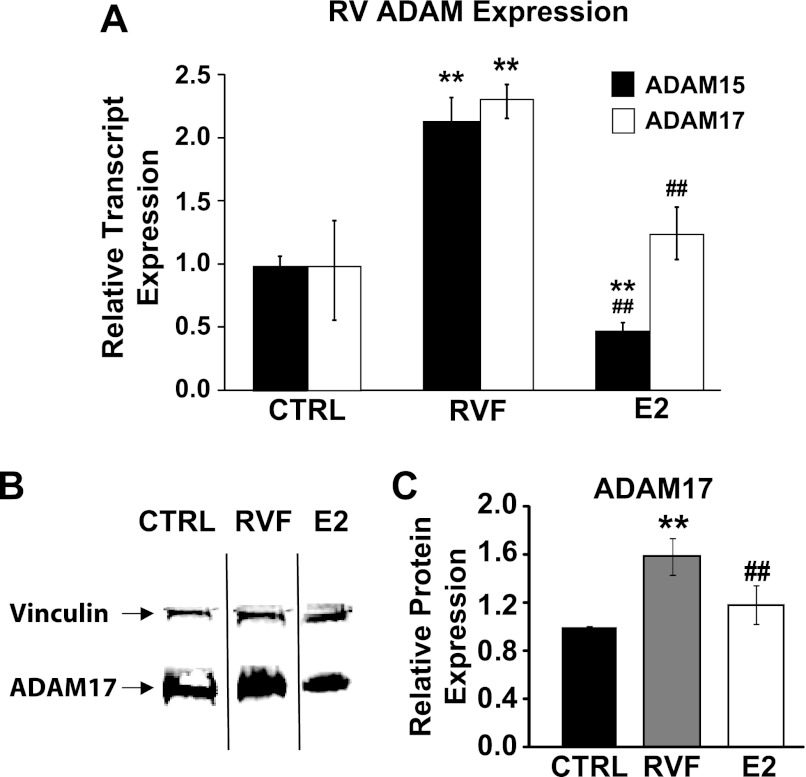
E2 reverses RV ADAM15 and ADAM17 expression induced by PH. A: ADAM15 and ADAM17 relative transcript expression in the RV in CTRL, RVF, and E2. B: Western blot showing ADAM17 (bottom band) and vinculin (top band) representative samples from CTRL, RVF, and E2 groups. C: quantification of ADAM17 relative protein expression normalized to vinculin and CTRL from Western blot in CTRL, RVF, and E2 groups. **P < 0.05 vs. CTRL; ##P < 0.05 vs. RVF.

