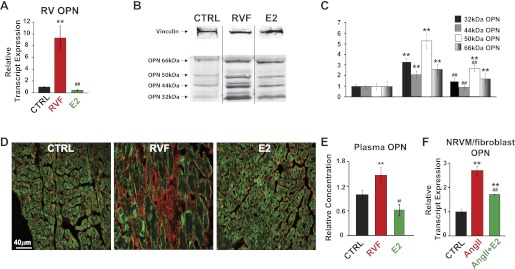
Fig. 5.
Osteopontin (OPN) expression is elevated in the RV of RVF group and is reversed with E2-therapy. A: OPN relative transcript expression measured in CTRL, RVF, and E2. **P < 0.05 vs. CTRL; ##P < 0.05 vs. RVF. B: Western blot showing 4 different length isoforms of OPN (bottom 4 bands, 32 kDa, 44 kDa, 50 kDa, and 66 kDa) and vinculin (top band) representative samples. C: quantification of OPN protein expression normalized to appropriate CTRL and vinculin protein from Western blot in CTRL, RVF, and E2 groups. **P < 0.05 vs. corresponding CTRL; ##P < 0.05 vs. corresponding RVF. D: staining of RV cross sections double labeled with L-type calcium channel α1c (green) and OPN (red). E: OPN plasma levels measured by sandwich-ELISA, normalized to CTRL in CTRL, RVF, and E2. **P < 0.05 vs. CTRL; ##P < 0.05 vs. RVF. F: OPN transcript expression in NRVM/fibroblast culture in CTRL, ANG II treated, and ANG II + E2 treated. **P < 0.05 vs. CTRL; ##P < 0.05 vs. ANG II.

