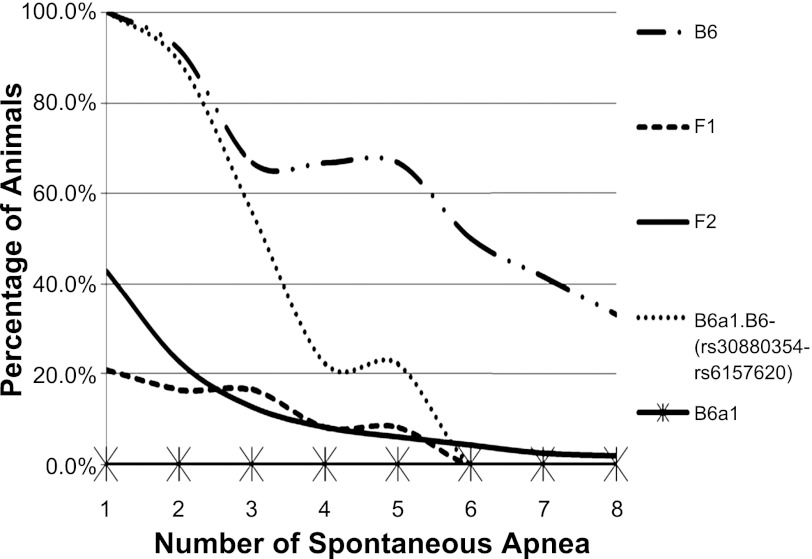
Fig. 2.
Shown are the pause phenotype distribution, as represented by trend lines, in the mouse strains and the first (F1) and second (F2) populations of mice reported in this study. Each line represents a different group of animals. The B6a1 animals did not exhibit apneas. The percentages of animals vs. number of apneas are displayed. There are significant differences among all curves (P < 0.032), and post hoc analysis revealed that F1 and F2 curves are similar (P = 0.35), but curves for B6a1, B6, and B6a1.B6-(rs30880354-rs6157620) congenic strains are different (P < 0.04).

